.avif)
- +47% higher average order value on orders the Shopping Assistant influenced, versus the same store's other online orders
- 1 in 7 (14%) Shopping Assistant conversations ends in an attributed order.
- 1.9% of online revenue is influenced by the Shopping Assistant, and up to 4% in considered-purchase categories
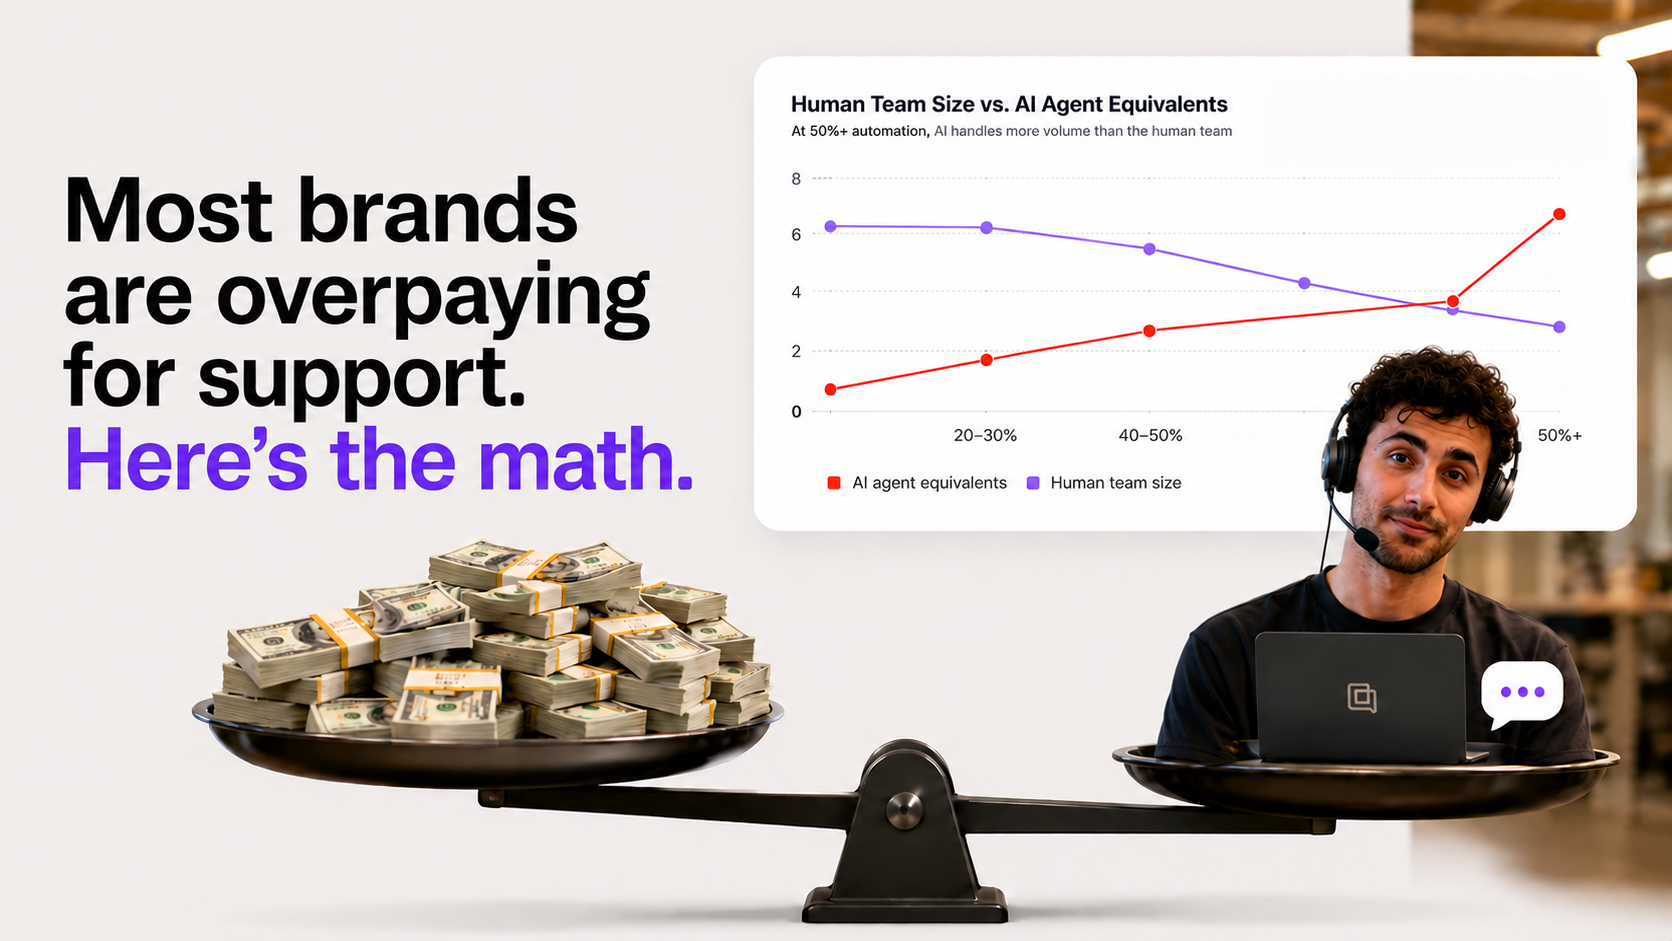
Support has a benchmark for cost. Conversational commerce needs one for revenue.
There is a good benchmark for what a support team costs: cost per ticket, tickets per agent, deflection rate, resolution time. Those numbers decide headcount and they decide whether AI in support pays for itself. That case is settled.
There is no equivalent benchmark for what conversational commerce earns. When a shopper opens the chat before they buy, asks two questions, and checks out with a bigger cart, that revenue does not show up in a support dashboard. It shows up as a slightly higher conversion rate and a slightly bigger order, with no label on it. So the assistant that produced it keeps getting measured on deflection, which is the wrong meter.
This report puts a revenue meter on it. It uses Gorgias platform data from brands running Shopping Assistant, the pre-purchase AI Agent, and reports three things: how often a conversation turns into an order, how much larger those orders are, and what share of online revenue the assistant touches. Then it breaks all three down the only two ways that matter to a brand deciding whether this is worth it: by GMV band, and by vertical.
The three numbers
Conversion. Across brands running it, about 14% of Shopping Assistant conversations end in an attributed web order within the assistant's three-day attribution window. Roughly one in seven. This is a conversation-to-order rate, not a site-wide session-to-order rate, so it does not compare directly to a 2 to 3 percent site benchmark. What it says is simpler: of the shoppers who actually engage the assistant, about one in seven goes on to buy.
Order value. Orders the assistant influenced carry an average value of $181, against $123 for the same store's online orders it did not touch. That is a 47% larger basket on the assisted orders. The gap is not a rounding artifact of one big merchant. It holds in every GMV band and almost every vertical, which is the part worth noticing.
Revenue share. On brands that have turned it on, the assistant influences 1.9% of online-store GMV. That sounds small until you annualize it against the revenue base it runs on, where it represents more than a fifth of a billion dollars in influenced GMV across the enabled brands. And 1.9% is the blended floor. The rate climbs to between 3 and 4 percent in the categories where shoppers need the most help deciding.
By GMV band: smaller catalogs convert a bigger share, larger catalogs convert a bigger basket
The influence rate and the basket size move in opposite directions as a brand gets larger, and both directions are useful.
Smaller brands see the assistant touch a larger share of revenue. More of their traffic runs through chat, their catalog is simpler to assist on, and a single good answer covers a larger fraction of their orders.
Larger brands route a smaller share through the assistant, but the orders it does influence are bigger, because the catalog is deeper and the decision is worth more. The basket uplift is the constant: assisted orders run 46 to 55 percent larger than unassisted ones at every size.
For a brand reading its own line: the question is not whether the assistant moves revenue in your band. It does, in all three. The question is which lever is larger for you. Under $30M, it is reach. Above it, it is basket.
By vertical: the assistant earns most where the purchase is a decision
The vertical cut is sharper than the band cut, and it is the one that tells a brand whether to expect a lot or a little.
The pattern is consideration. The assistant earns the most in categories where the purchase is a decision the shopper wants help making: vehicles and parts, furniture and outdoor gear, electronics, equipment. These are high-ticket, spec-heavy, returns-sensitive buys where a fast answer to the right question is the difference between a sale and a closed tab. In those categories the assistant influences 3 to 4 percent of revenue and lifts the basket by half or more.
It earns the least where the purchase is a habit. Food and beverage is the clean example. The influence rate is low and the basket uplift is slightly negative, because a shopper reordering coffee or supplements does not need a conversation, and the assistant has little room to help. That is a real result, reported as-is. The assistant is a revenue lever for considered purchases, not a universal multiplier.
Apparel and beauty sit in the middle, and they are instructive. They generate the largest absolute influenced revenue of any category, because their traffic is enormous, but they do it at a lower rate, because much of that traffic is simple repeat buying. High volume, modest rate, still a large dollar number. A brand in these categories should expect a meaningful revenue line, not a headline percentage.
One signal points the other way, and it belongs in the same breath as the basket-size win. Early internal analysis suggests the refund rate on assisted orders runs higher than on orders a human agent assisted. The plausible read is that an assistant which moves a hesitant shopper toward a larger basket also surfaces some orders that do not survive a second look. That is a theory, not a proven cause, and the attribution data used here does not carry order-level refund status, so this report does not put a number on it. It is a counter-signal to watch and to net against the basket uplift, not a settled finding.
How solid is the attribution? About a fifth of it is a fingerprint. The rest is association.
Every figure above is associative, and it is worth being precise about how associative. Each influenced order carries one attribution signal, and they range from weak to strong. Sorting the revenue by that signal is the honest way to read the benchmark.
About 80% of influenced revenue comes from the weakest signal: the shopper had a Shopping Assistant conversation and then placed an order within three days, with nothing further tying the assistant to the specific purchase. That revenue is real, but it is the kind most exposed to selection, because the shopper who opens the assistant was already more likely to buy.
About 18% comes from a stronger signal: the assistant suggested a specific product and that product was in the order. That is not proof of cause either, but it is a fingerprint, an assistant action attached to the exact item bought. Those orders also run larger, $193 against $171 for the conversation-only orders, which is what you would expect if the assistant is adding an item rather than standing next to a sale that was always going to happen. The remaining 2% is other in-chat actions: a product card clicked, an item added to cart from the chat.
So read the benchmark in two layers. The gross figure, 1.9% of online revenue at a 47% larger basket, is everything the assistant touched. The hard core, the roughly one order in six where the assistant recommended what got bought, is the part that is hardest to argue with. Quote the gross number for scale, the hard core for defensibility.
One objection this clears on the way past: the uplift is not bought with discounts. Assistant discount codes appear on under 1% of influenced revenue, and the orders that use them are smaller, not larger, than the ones that do not. The bigger basket is the assistance, not a coupon.
Around the clock: revenue does not keep business hours, and neither does the assistant
The clearest argument for putting an assistant on the buying question is not a conversion rate. It is a heatmap.
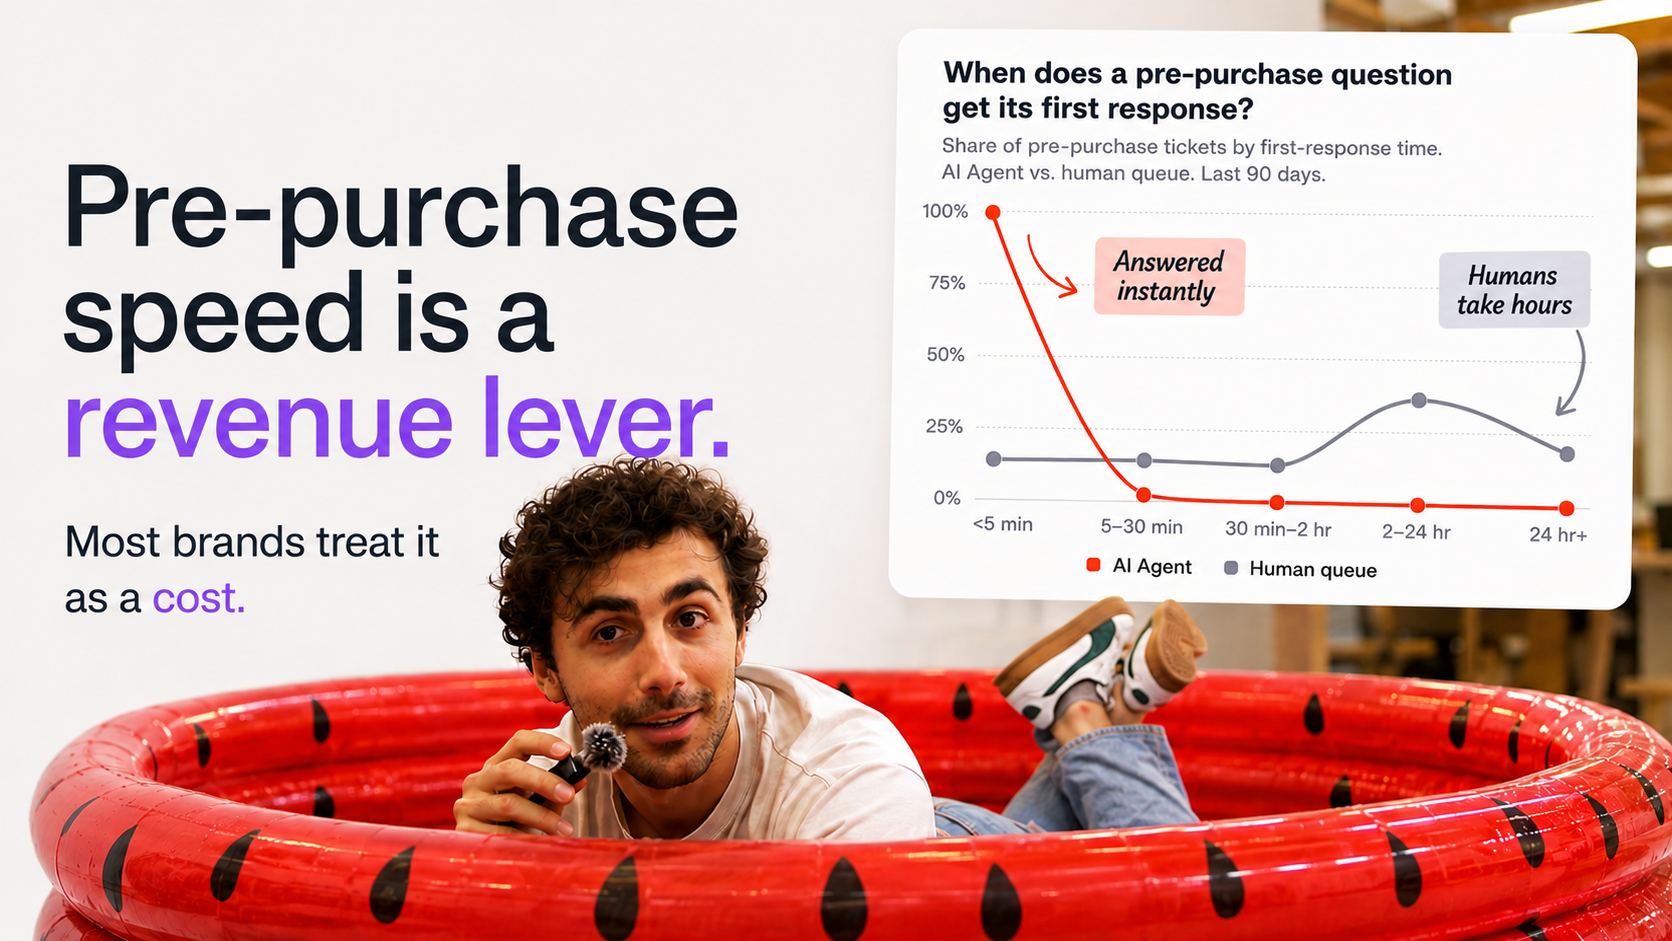
Plot every assistant-influenced order by the hour of the week it was placed, and the grid fills in completely. All 168 hours carry orders. The busiest single hour of the week runs only about three and a half times the quietest one. Demand for a pre-purchase answer is remarkably flat across the clock and across the weekend. Staffing is not. The overnight and weekend hours that a human chat queue covers thinly, or not at all, still carry thousands of orders. The assistant is the only thing standing in the buying window when the team is offline, and the data says the buying window never closes.
This is the support speed gap from the revenue side. A pre-purchase question that waits until morning is not a late ticket. It is a basket that already checked out somewhere else.
How to use this in a revenue conversation
This benchmark is built to be said out loud to a brand, not just filed. Three ways to use it.
Lead with the brand's own line. A $40M outdoor-gear brand does not need the platform average. It needs its band and its vertical: assistant-influenced orders run about half again larger, the assistant touches roughly 3 percent of online revenue in its category, and that revenue arrives at every hour the team is not staffed. That is a number a brand can check against its own dashboard.
Frame it as net-new, not redistributed. The revenue on assisted orders is not deflected support cost reclassified as sales. It is basket size and conversion the brand was otherwise leaving on the table during the consideration moment, much of it outside business hours. It is also not bought with discounts: assistant codes appear on under 1% of influenced revenue, and the orders that use them are smaller, not larger. It nets against the platform cost the same way support savings do, and it stacks on top of them.
Set the expectation honestly, including the watch-items. In considered-purchase categories, expect a 3 to 4 percent revenue line and a large basket uplift. In habitual categories, expect a smaller line and lead with coverage rather than basket. Quote the gross benchmark for scale, and the suggested-then-bought core, about one order in six, for the part that is hardest to argue with. Everywhere, net the basket uplift against a refund rate that may run higher, and revisit it once order-level refund data is wired into attribution. A benchmark a brand can trust is one that tells them where it is weak.
The bottom line
Support earned its AI budget by proving it cuts cost. Conversational commerce earns its budget by proving it makes revenue, and until now that proof had no benchmark. It does now. The assistant influences about 1.9% of online revenue on the brands that run it, lifts the assisted basket by 47%, and converts about one in seven of the shoppers who engage it, with the strongest returns in the categories where buying is a decision and the steadiest returns in the hours no team is online.
The number a brand should walk away with is not the platform average. It is the intersection of its GMV band and its vertical, netted against the cost it replaces and the refunds it should watch. That intersection is where the revenue case for the Shopping Assistant stops being a story about support and starts being a line on the revenue plan.
Read the whole thing back and the shape is simple. The Shopping Assistant is the rare influencer a brand can audit. It works every hour, takes no commission, and you can see exactly what it moved.
Methodology
Platform-level commercial data from Gorgias merchants running the Shopping Assistant, the pre-purchase AI Agent. Customer-status accounts only; trials and internal Gorgias instances excluded. Revenue metrics use the Shopping Assistant order-attribution pipeline over the last 31 complete days; Shopping Assistant data is valid from its July 17, 2025 launch date. An order is "influenced" when a shopper interacted with the Shopping Assistant before completing a web purchase, within the assistant's three-day attribution window. This is associative attribution, not proof of cause: higher-intent shoppers self-select into the assistant. To bound that, influenced orders are also split by attribution signal: about 80% of influenced GMV carries the weakest signal (a conversation preceded the order, ai-sales-agent-discussion-started), about 18% the stronger suggested-then-bought signal (product-suggested-ai-sales-agent), and about 2% other in-chat actions.. Assistant discount codes appear on under 1% of influenced GMV and those orders carry a lower average value, so the uplift is not discount-driven. Average order value uplift compares influenced web orders to the same accounts' non-influenced web orders, the cleanest same-merchant baseline. The revenue influenced rate is influenced GMV as a share of online-store (web) GMV on the same enabled accounts, excluding in-store (POS), wholesale, and marketplace orders. Chat conversion rate is the share of Shopping Assistant sales conversations that led to at least one attributed web order; it is a conversation-to-order rate, not a site-wide session conversion rate. Verticals use the account vertical trait; only verticals with at least 10 accounts are shown. The hour-by-week pattern plots assistant-influenced web orders by created hour over the last 90 days, in UTC, as a network-wide pattern rather than a single timezone. Refund rate is reported as a qualitative counter-signal only: order-level refund status is not part of the attribution pipeline, so this benchmark does not quantify it, and the upsell-to-remorse explanation is a theory, not a validated conclusion. Efficiency, headcount, and net-savings figures are cited from the AI Adoption Index and Support Economics rather than re-derived here. Median and same-account baselines are used where distributions are skewed. Data as of June 2026.