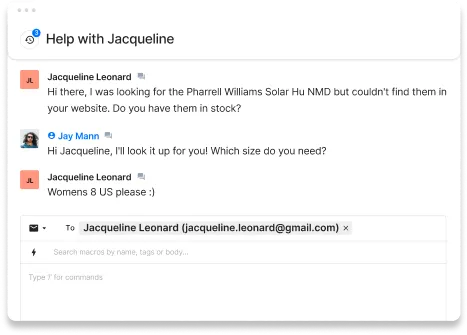
Creating a unique and satisfying customer experience is a crucial objective for brands across all industries. You’re probably already aware that most customers (95%, according to a Microsoft study) rank customer experience as important when it comes to brand choice and brand loyalty.
Most brands rely on customer satisfaction scores (CSAT) as the go-to metric for evaluating the customer experience. However, the problem with CSAT is that it's a lagging indicator of customer sentiment. Customers give you a CSAT score after an interaction. So, if your CSAT is low, you've likely already frustrated a new or loyal customer by the time you realize there is a problem.
Thankfully, tracking additional customer satisfaction metrics can go a long way toward filling the gap and ensuring that you can keep a finger on the pulse of your customer base. Below, we'll explore the best customer satisfaction metrics to track so that you can optimize your customer support services and overall customer journey — before your customer loyalty takes a hit.
12 customer satisfaction metrics to better understand sentiment
Along with CSAT and NPS, you can use numerous other metrics to gauge customer satisfaction. If you want to create a holistic picture of how happy customers are with your brand, here are the 12 metrics that you should track and analyze.
1) Customer effort score (CES)
CES tells you how much effort your customers have to put in to get answers to their questions or resolve their support issues.
By tracking this metric, you can identify high-effort customer experiences like long wait times when customers contact your call center or confusing responses from your support team. This gives you a great starting point so that you can address these obstacles that are inevitably harming customer satisfaction.
Customer effort is an extremely important indicator for the quality brand’s customer experience. Plus, it’s directly connected to your bottom line. 96% of high-effort experience drive customer disloyalty, according to The Effortless Experience.

Formula for calculating CES
To measure CES, you will need to send customers CES surveys. These surveys ask customers to rate on a scale of one to ten how much effort they had to exert to get an answer to their question. To calculate your overall CES score, you will need to divide the total sum of all responses by the total number of all responses.
CES = Total sum of responses / Total number of responses
2) Customer health score (CHS)
CHS is a metric largely employed by customer success teams to determine whether a customer is "healthy" or "at risk."
This enables customer success teams to identify customers who are at risk of leaving the company so that you can make efforts to retain them.
Unlike other customer satisfaction metrics, this metric is measured on a customer-by-customer basis rather than the average score of your entire customer base. This enables brands to utilize CHS to boost customer retention one customer at a time.
Formula for calculating CHS
There is no set formula for calculating CHS, and brands utilize a broad range of criteria to evaluate the health of individual customers. These criteria can also vary dramatically from industry to industry and even company to company.
But for ecommerce stores, here are a few important factors to consider when determining whether a customer is healthy or at risk:
- Customer survey results
- Contact rate with your support team
- Number of closed and open support tickets
- Social media involvement
- Email engagement rate
Especially for larger brands, we recommend creating a standard formula to measure customer health, and periodically measuring each customer (especially VIP customers) to proactively prevent customer churn.
{{lead-magnet-1}}
3) Customer lifetime value (CLTV)
The primary point of reducing churn and improving customer loyalty is to increase your average customer lifetime value.
Attracting new customers is difficult and expensive, and when you succeed at bringing a new customer into the fold, you want them to spend as much money with your brand as possible.

Lifetime value can indicate customer satisfaction because satisfied customers tend to spend more with companies they’re satisfied with. Continued spending and repeat purchases are a surer sign on satisfaction than any star rating could provide.
Formula for calculating CLTV
CLTV = Average purchase value x Average purchase frequency x Average customer lifespan
4) Customer churn rate (CCR)
Customer churn rate is the rate at which customers leave your company. For subscription-based online businesses, ecommerce churn rate is the rate at which people cancel subscriptions. For non-subscription-based companies, you can define churn as shoppers who fail to place a repeat order within some time frame (likely between one and six months, depending on your products and industry).
If your churn rate exceeds industry benchmarks, it almost certainly spells issues with your customer experience.

Reducing churn goes hand in hand with improving customer loyalty (and thus boosting revenue via higher customer lifetime values). If you can keep a handle on churn rate, you’ll have concrete evidence about how customer satisfaction is impacting your repeat business.
Formula for calculating CCR
CCR is calculated over a specific period. To calculate your churn rate for a given period of time, you can use this formula:
CCR = (Number of customers at the beginning of the time period - Number of customers at the end of the time period) / Number of customers at the beginning of the time period
5) Internal quality score (IQS)
IQS measures the quality of each of your support team's tickets, according to your own internal standards. For instance, you may define a good ticket as a ticket that resolves the customer's issues, reflects your brand voice and values, and is responded to promptly. A bad ticket might be any ticket that falls short of these standards.
If you’re like most brand, your IQS will revolve around four main elements:
- Speed: Did the agent respond within the terms of your service-level agreement (SLA)?
- Correctness: Did the agent’s response adhere to your company’s relevant policies?
- Helpfulness: Did the agent full address the customer’s question (and practice forward resolution)?
- Friendliness: Did the agent maintain a positive tone and use the powerful phrases that adhere to your company’s style guide?

With an IQS, you can proactively identify where your customer support agents are currently improving satisfaction (or degrading it).
Formula for calculating IQS
We don’t have a clear calculation for IQS because each brand’s is different. However, we recommend using a simple rubric, where a ticket gets a point for meeting each item on the rubric.
This way, you can simply compare the quality of each ticket (or the average quality of each agent’s tickets). You’ll also get valuable information about the missing elements of each ticket, which can inform your customer service training.
6) First response time (FRT)
One thing that is sure to generate a lot of unhappy customers is making them wait a long time for answers to their questions. 90% of customers rate an immediate response as "important" or "very important" when they have a customer service question.
Therefore, attempting to reduce your FRT is one of the first steps to take on the road to optimizing customer satisfaction. This starts with tracking your average FRT and comparing it against industry benchmarks.

Formula for calculating FRT
Depending on your helpdesk, you may never need to manually calculate first-reply time. For example, with Gorgias, you get first-response time broken down by agent, time period, ticket type, and more:

To calculate your support team's average FRT, you can use this formula:
FRT = Total first response times during the time period / Total number of resolved tickets during the time period
📚Recommended reading: 7 tips to improve your customer service response times.
7) Resolution time
It's important to respond to customer support tickets as fast as possible, but not all tickets can be resolved in a single response.

While customers who have received an initial response to their ticket tend to have a little more patience when waiting for a resolution, that patience will only stretch so far. This makes it important to calculate and improve your average resolution time and FRT.
Formula for calculating resolution time
Just like first-response time, average resolution time isn’t normally something brands should spend time calculating. That’s why Gorgias users can see resolution time broken down by agent, time period, ticket type, and more:

Average resolution time = Total resolution times during the time period / Total number of resolved tickets during the time period

8) First-contact resolution
While it's true that you can't resolve every ticket with a single response, it's still a great objective for support teams to strive for. Resolving a customer's issue in a single response typically means that the customer received swift and satisfactory assistance that required minimal effort on their part. Therefore, working to boost your first-contact resolution rate is sure to improve customer satisfaction.
Formula for calculating first-contact resolution
To get an accurate evaluation of your first-contact resolution rate, you should only consider tickets that are possible to resolve in a single response. Once you've identified the criteria for tickets that are FCR-eligible, you can use this formula to calculate your FCR rate:
FCR = Number of support issues resolved on first contact / Total number of FCR-eligible support tickets
9) Self-service resolution rate
Enabling customers to resolve issues on their own without needing to contact your support team offers numerous benefits — like reducing agent workload and freeing them up to focus on more complex tickets.
Additionally, it provides customers with helpful self-service options, which improves customer satisfaction by ensuring that customers can quickly find the answers they need.
But to evaluate how effective your self-service options actually are, you'll need to track your self-service resolution rate. This metric tells you the rate at which customers can resolve issues on their own and can be used to gauge and improve the quality of your self-service resources, like your FAQ pages and Help Center.
Formula for calculating self-service resolution rate
Depending on your helpdesk, you may never need to manually calculate self-service resolution rate. With Gorgias, for example, you get detailed information about the usage of self-service resources on your site:

That said, you can calculate your self-service resolution rate using this formula:
Self-service resolution rate = Number of sessions that customers initiate with your brand's knowledge base or other self-help resources / Number of support tickets your support team handles over the same period of time
📚Interested in helping your customers help themselves for a low-effort experience? Check out our VP of Success's guide to customer self-service.
10) Support performance score
Support performance score (created by Gorgias) is a metric that encapsulates the three most important elements of great customer service: speed, helpfulness, and customer satisfaction.
To achieve this, the support performance score combines average first response time, average resolution time, and CSAT into a score that is on a scale of 1-5.
Tracking this metric provides support teams with a comprehensive overview of their performance quality.

Formula for calculating support performance score
Support performance score is calculated using a series of FRT, CSAT, and resolution time thresholds. To reach the next rating level, you must meet each category's threshold. Here is an example of what these thresholds look like for FRT:
- Level 1 (poor): 13+ hours
- Level 2 (lagging): 12 hours
- Level 3 (fair): 6 hours
- Level 4 (strong): 1 hour
- Level 5 (exceptional) 10 minutes
11) Customer satisfaction score (CSAT)
Customer satisfaction (CSAT) is the go-to customer support metric to understand customer sentiment around your brand and customer experience. Don’t get us wrong: We believe CSAT is one of the most important metrics. However, CSAT only gets measured after customers have a good or bad experience, making it a lagging indicator of customer sentiment.
You can determine your CSAT score using customer satisfaction surveys. The survey questions should ask customers to rate their satisfaction with your company by choosing from one of four responses: very unsatisfied, unsatisfied, neutral, satisfied, and very satisfied.

The ratio of customers who were either satisfied or very satisfied compared to the total number of customers who were unsatisfied or very unsatisfied is your brand's CSAT score.
While CSAT is certainly an important metric for ecommerce brands to measure and utilize, it isn't the end-all, be-all of tracking customer satisfaction. Brands that only track CSAT can encounter several limitations that can make it difficult to turn customer satisfaction results into business growth.
12) Net promoter score (NPS)
NPS is a metric that tells you how likely customers are to recommend your brand to friends, family members, and colleagues. If you want to improve your word-of-mouth advertising and start generating more referrals, NPS is the metric you will need to optimize.

Your NPS score can also provide insight into the overall satisfaction of your customer base.
For one, NPS isn't quite as subjective and one-dimensional as CSAT, since it asks customers to rate their willingness to recommend your company on a scale of 0-10 rather than asking them a single question about their satisfaction.
NPS is also more a measure of a customer's long-term satisfaction with your company, while CSAT surveys typically gauge a customer's short-term satisfaction with your product or service.
How to calculate NPS
NPS surveys gather feedback on how likely customers are to recommend your brand on a scale of 0-10. Customers who rate you at 0-6 are considered detractors; customers who rate 7-8 are passives, and customers who rate 9-10 are your promoters.
To calculate your brand's NPS, you will need to calculate your promoters and detractors as percentages of your total number of survey responses. Then, subtract the percentage of detractors from the percentage of promoters.
So, if you got 100 responses with 40 promoters and 30 detractors (the rest being passives), here's what your calculation would look like:
NPS = 40% promoters - 30% detractors
NPS = 10

For more information on measuring NPS, check out our helpful resource on the topic.
Why CSAT isn't the only metric you need to measure customer satisfaction

CSAT is a vital benchmark for analyzing your brand's number of satisfied customers. However, here are the three most important reasons why CSAT alone is not enough:
CSAT is a lagging indicator
We've already mentioned that the CSAT score doesn't indicate an issue with the overall experience at your company until it's already too late, when you've already provided a poor experience to customers.
This is an especially pressing issue when you consider that nearly a quarter of customers will switch to a competitor after a bad experience. Their CSAT results can help you improve the experience for future customers — but ideally, you don’t have to lose customers to get this information.
Ideally, your set of metrics to understand customer satisfaction include ones that don't require angry customers to tell you that your customer experience could be improved.
CSAT is one-dimensional
CSAT tells you the ratio of customers who are satisfied with your brand compared to the number of unhappy customers, but it doesn't tell you anything about why your customer satisfaction levels are what they are.
Most CSAT surveys have a comment box, but customers rarely take the time to fill these out — especially with any meaningful level of detail.
A more well-rounded collection of metrics will help you better pinpoint the reason for high or low satisfaction, without solely depending on an optional comment box.
CSAT is subjective
Asking customers a single question about whether they are satisfied with their experience will yield highly subjective responses.
For instance, a specific issue might cause one customer to state they are "very unsatisfied," while the same issue might prompt another customer to respond with "neutral."
Plus, customers may complete the survey while annoyed, emotional, or tired — all of which could inflate (or minimze) the importance of an issue, skewing the insights.
For these reasons, CSAT offers the most value when used in tandem with other important customer satisfaction metrics — and the first of these important metrics is net promoter score (NPS).
How to improve customer satisfaction by collecting (and using) customer feedback
Metrics such as CSAT, NPS, and CES are all forms of customer feedback that ecommerce merchants can use to improve customer satisfaction. But along with tracking these metrics, gathering more in-depth customer feedback can be highly helpful for informing your customer satisfaction efforts.
A few of the ways that ecommerce brands can go about collecting and utilizing valuable customer feedback include:
- Audit low-scoring tickets to look for themes.
- Reach out to low-scoring customers for in-depth feedback.
- Reduce ticket volume with automation and self-service to free agents to solve complex tickets.
- Activate instant messaging channels like SMS and live chat.
📚Recommended reading: Our Director of Support’s guide to implementing customer feedback into your product and customer experience.
{{lead-magnet-2}}
Analyze customer satisfaction from all angles with Gorgias' dashboards
There are numerous metrics that support teams need to track to evaluate and improve customer satisfaction. Thankfully, Gorgias' best-in-class customer support platform makes tracking these metrics easier than ever before. With Gorgias' dashboards, you can:
- Automatically track key support performance metrics such as FTR and resolution rate
- Access revenue statistics to see how customer support is impacting your company's bottom line
- Live statistics that allow you to monitor agent performance in real-time
- Send customers automated customer satisfaction surveys
To get started utilizing these powerful tools to track and improve customer satisfaction, sign up for Gorgias today!


.png)


