If you’re using a live chat for your ecommerce business — to support customers, drive sales, or both — you already know it’s a powerful tool.
That tool is made even mightier with analytics and reporting. Stores that don’t track support metrics for live can only take educated guesses to answer questions like:
- When should we staff live chat? How many agents do we need at any given time?
- How does live chat support performance compare against other channels?
- How does live chat compare to other pop-ups in terms of conversion rates?
Below, we’ll cover key live chat metrics that go beyond your response and resolution times. You’ll also get finer insights about how your chat strategy boosts your bottom line.
Don’t have live chat yet? Check out our list of the best live chat software (or, the best chat apps for Shopify or BigCommerce).
What do online shoppers expect from live chat?
Before you look into analytics and reporting for your live chat operations, it’s good to get a baseline of how customers expect live chat to fit into the customer experience.
Here are some statistics that highlight what your shoppers expect from your live chat support operations.
- 42% of customers want a response within 60 minutes on social media (Convince & Convert).
- Customers expect a response within 45 seconds for live chat (Com100).
- 53% of customers are willing to wait only three minutes to talk to an agent on the phone (BizFluent).
People want to get things done as quickly as possible. Ultimately, it’s best to start where you are and work on improving internally. But, when you know how you stack up to the competition, it can help.
{{lead-magnet-1}}
Next, take a look at the key performance indicators (KPIs) you should follow.
📚 Read more:
- 25 Customer Support Metrics To Measure Your Team’s Impact & How to Calculate
- 22 Live Chat Statistics You Need To Know in 2022
The Live Chat Support Metrics You Need to Follow
To get a complete understanding of where you stand and where your customer support team can improve live chat efforts, here are the metrics you should follow (in no particular order).
1) Contact rate
Your contact rate is the percentage of active customers that reach out to you via your chat strategy on any given day, month, year, or other period of time.

Contact rate is tricky: If customers are messaging you with pre-sales questions, that’s a good thing. They’re deep in the consideration phase and need information about sizing, returns, or shipping to make a purchase.
But if people are messaging you with post-sales questions (like “Where is my order?” or WISMO) then you have a problem. A high number of these chats indicates some part of your customer support information is unclear or confusing.
Remember that avoidable customer support interactions — not counting pre-sales interactions, which are more like a sales consult — are actually 4x more likely to drive customer disloyalty than customer loyalty. A low rate indicates that customers are able to find everything they need without your help.

How to measure contact rate
The formula for determining your contact rate is to divide the number of customers who reach out via live chat in a time period, such as month, by the total number of customers. Then multiply by 100.
For example, if you had 500 customers in December, and 153 of them reached out for help via live chat, your contact rate would be 30.6%.
If you use a helpdesk like Gorgias, you can see contact rate broken down by channel, agent, and more right within the platform.
Tips to improve contact rate
Analyzing why customers contact you via live chat will help you reduce your contact rate.
For example, most customer inquiries tend to be about shipping and tracking. If you’re getting many questions about your shipping policies, that indicates you haven’t made this information clear and easy to find on your website.
Another solution is to add self-service options to your chat widget for frequently asked questions, such as shipping info, parcel tracking, and order cancellation. You can add these as buttons or as automated chatbot replies.
📚 Read more:
- Customer Service Messaging: Tips and Templates for SMS + Conversational Channels
- Playbook: How Berkey Filters Drove Customer Adoption of a New SMS Support Channel
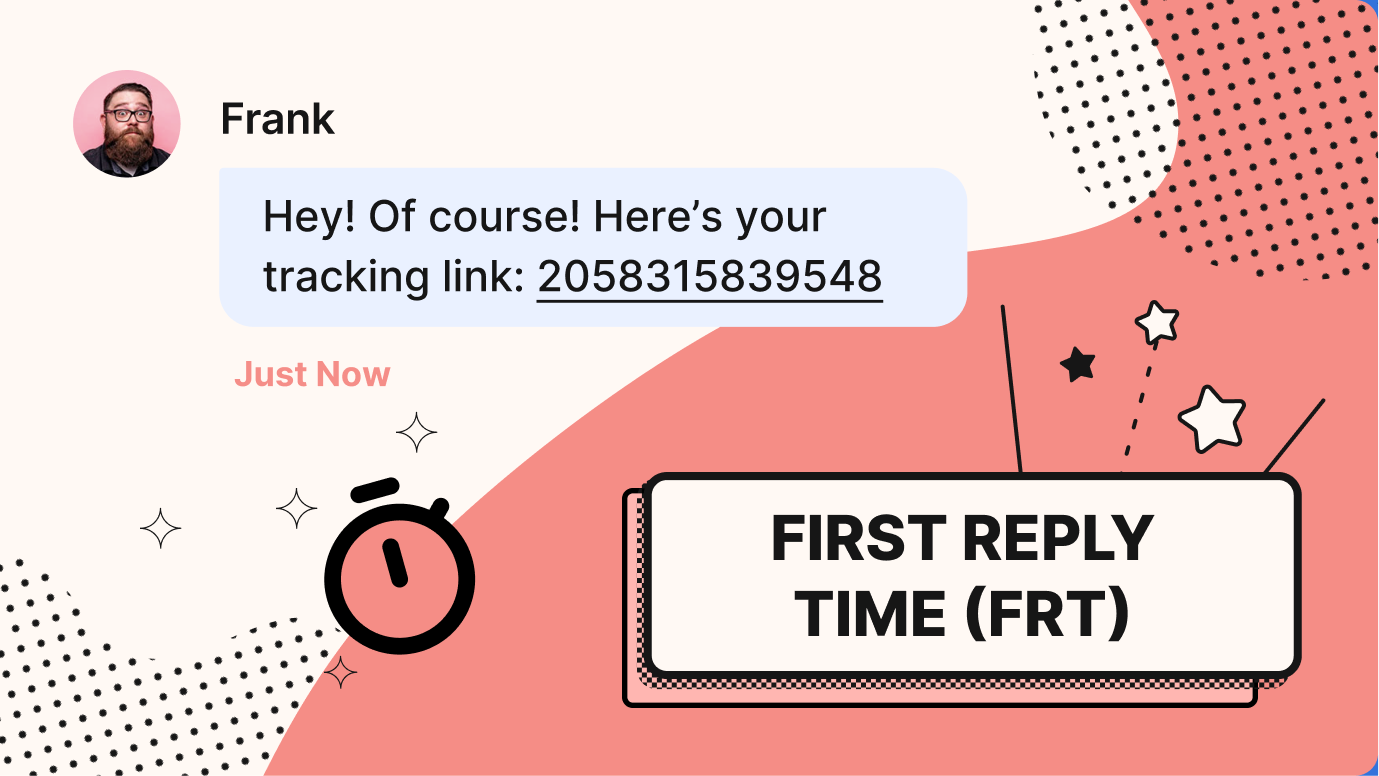
2) First-response time
Your first-response time (FRT) is also called your average wait time — essentially how long it takes to reply to a new chat from a customer. Specifically, it’s the response to the very first chat message from a customer.
Customers have high expectations when using a chat widget. According to Klipfolio, users expect a response via chat within 90 seconds, compared to 24 hours for email. That’s fast! But that’s why customers prefer chat when it’s available.
Your first interaction with a customer is a crucial time to secure their trust and loyalty with a fast response. Faster responses mean a higher customer satisfaction (CSAT) score, which we’ll discuss further in depth later on.
Your first-response time should become shorter over time. When you see a decrease in first-response time without a spike in website traffic, it is a cause for concern and should be looked into.
How to measure FRT
Your first-response time can be calculated by determining how long it took to respond to every first chat message within a time period, then dividing by the number of messages.
For example, if it took 74,000 seconds to respond to 800 tickets in September, the first-time response rate was 92.5 seconds, on average.
Thankfully, a helpdesk such as Gorgias can provide this number to you.

Tips to improve first-response time
Improving your first-response time requires you to have support agents available if your live chat is set to active.
Make sure to set your business hours in your chat widget. This way, after-hours customer inquiries will be converted to an emailed ticket. Appearing offline also sets customer expectations, letting them know a response won’t come until the next day.
Keep an eye on those metrics to determine if there are particular days, hours, or seasons when incoming chats rise and more support employees need to be on hand.
3) Average response time
While the first-response time is all about that initial chat message, your average response time is how long it takes to respond to any and all incoming chat messages.
That first-response time benchmark of 90 seconds still applies here — you don’t want your customer to get a quick first response and then grow frustrated as responses take longer.
How to measure average response time
To calculate this, add up the total time your team has taken to respond to requests during a specific time period, then divide by the number of responses sent during that same time period.
For example, if your team spent 72,800 seconds responding to 800 messages, that’s an average chat response time of 91 seconds.
Again, Gorgias’ metrics can provide this number for you.
Tips to improve average response time
This is another opportunity for self-service options and chatbots to shine.
Gorgias’ Automation Add-on allows you to add self-service order management options and quick response flows to your chat widget, giving customers instant answers to their questions or options for tracking or canceling orders.
4) Resolution Time
The resolution time is how long it takes for a customer’s issue to be resolved after they first reach out via chat. This is also called the average resolution time (ART) or average handle time.
This includes the entire chat duration, starting when they send that first message, and ending when they’re satisfied their concern is addressed.

Use this metric to determine how long it typically takes to solve your customers’ problems. Like first-responses, they want a resolution as quickly as possible.
Similar to first-response time, customers expect a quicker resolution when they start a chat session then when they reach out via email.
How to measure resolution time
The average resolution time is calculated by dividing the total duration of all chat conversations in a given time period, divided by the number of customers.
You can also see this number in your Gorgias help desk metrics.

Historical view of average resolution time
Tips to improve resolution time
You can use automation to speed response and therefore resolution times.
Study your incoming messages to determine frequently asked questions and create templated responses (or Macros, in Gorgias) and then create automated Rules to respond to tickets.
In Gorgias, these templated responses can be sent quickly and efficiently, and can even pull in personalized customer information like names, order numbers, and tracking info.
5) First-contact resolution rate
Also called the first-contact resolution (FCR) rate looks at how many incoming chat sessions are resolved with a single reply. These are also called one-touch tickets.
Solving issues with a single reply is the best-case scenario with incoming chat requests. As we mentioned earlier, high-effort customer support interactions drive disloyalty, so keeping these interactions short and sweet will increase customer satisfaction.
How to measure first contact resolution
The FCR rate is calculated by finding the total number of chats resolved with a single reply, and dividing it by the total number of incoming chats that were eligible to be resolved with a single reply.
Tips to improve first contact resolution
In addition to automation and self-service options we’ve already discussed, this is a KPI where it’s worth digging into your chat history.
If a chat session took more than one response to be resolved, ask yourself:
- Is there a way you can speed up the process for next time?
- Is there a new automation you can add?
- Could you practice forward-resolution by proactively answering common follow-up questions in the first response?
Complex issues will inevitably take several responses to solve, but aim to streamline as many common chat requests as possible.
{{lead-magnet-2}}
6) Customer satisfaction (CSAT) score
While a little more complicated to calculate, your customer satisfaction (CSAT) score is the ultimate measure of the impact your customer service is having.
The customer satisfaction score measures how a customer feels about your store’s customer support. Was it quick? Was it low-effort? Was your customer service team helpful? It’s estimated that businesses lose $75 million every year due to poor customer service, so keeping customers satisfied is no longer optional.
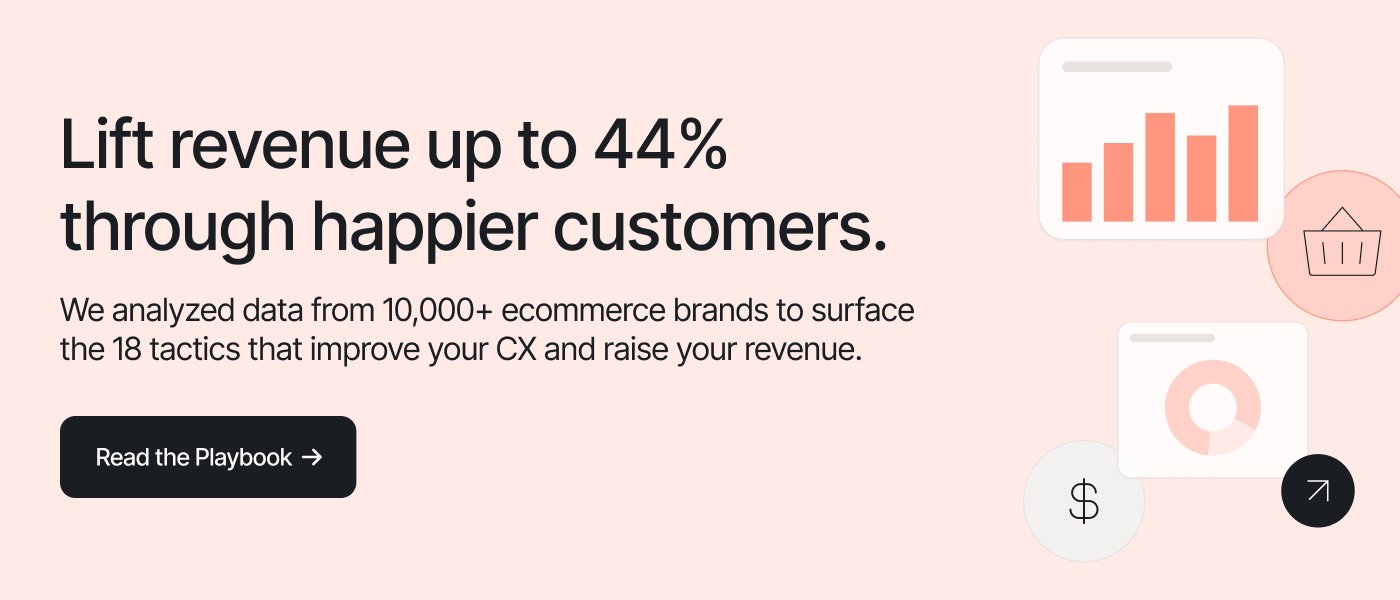
By contrast, happy customers lead to conversions and repeat business. Gorgias analyzed over 10,000 businesses and found that raising CSAT score by just one point — from 4 to 4.9 — lifts overall revenue by 4%.

According to Retently, the average CSAT score for ecommerce businesses is 75. Customer satisfaction rate can also be expressed as a number from 1 to 5, 5 being the best.
How to measure CSAT
To get your CSAT score, you need to survey customers who have interacted with you via chat. This can be done with a survey tool, or with Gorgias.
Ask customers who used your chat: “On a scale from 1 to 5, how satisfied are you with your experience today?” Then, add up how many gave a rating of 4/5 or 5/5 and divide that by the total number of responses. Multiply by 100 to get your CSAT score.
Using Gorgias, customers are asked to rate their experience, showing you a CSAT store in your dashboard out of five. We recommend our customers, all of whom are ecommerce merchants, aim for a CSAT score of 4.8.

Tips to improve CSAT score
Using Gorgias, you can review all chat ratings as all customers are given a post-chat survey. You can use this to examine common themes for any interactions scored below 4 stars. What issues keep coming up? Do particular products result in lower scores than others?
You can also follow-up with customers who gave a low score to further investigate what went wrong with these detractors.
Issues that can impact your CSAT score — and that you can work on improving — include:
- Long wait times for responses
- Multiple messages needing to be sent
- Long resolution times
📚 Read more:
- 9 Ways To Improve Your CSAT Score and Response Rate
- Evaluating Your Customer Service Program: Why, Challenges, and KPIs That Matter
7) Customer effort score
This is a complement to your CSAT as well as NPS (net promoter scores). The customer effort score measures how much effort a customer felt like they had to put in to resolve their issue.
This score should be as low as possible. Ideally, you want customers to find your customer service to be effortless, breezy, and efficient. High effort interactions will in turn hurt your CSAT and your revenue.
According to The Effortless Experience, 96% of customers who had a high-effort customer service experience feel disloyal to the company after.

How to measure customer effort score
Similar to your CSAT score, customer effort can be measured with a survey that asks customers to rate how easy their experience was on a scale of 1 to 5.
Find the percentage that said “very easy” and then subtract the percentage that said “very hard.” This will give you a score of between -100 and 100.
Tips to improve customer effort score
The more messages a customer has to send via your live chat, the more effort it will take on their part to resolve the issue.
Using automation, increasing response times, and aiming for one-ticket resolutions will improve your customer effort score.
📚 Read more: Customer Delight Is A Losing Strategy in Ecommerce: Here’s What’s Better
8) Conversion rate
Is your customer service chat tool actually leading to more sales, also known as conversions? Are you successfully turning chat requests into sales?
Chat is a great way to contribute to your conversion rate optimization (CRO) strategy since you talk with customers while they’re still on your store (and hopefully contemplating a purchase).
Pre-sale information given via chat, like finding the right size or inquiring about your return policy, have a high chance of leading to a sale.
How to measure conversion rate
The conversion rate is calculated by total sales after a customer support interaction divided by total number of tickets.
The Gorgias dashboard shows you how many tickets led to sales within five days, which reveals your conversion ratio. Apply a channel filter for live chat to show how many of these were the result of a live chat session,
As well, Gorgias shows you the hard numbers of your total sales numbers that came from a support interaction.

Tips to improve conversion rate
The best way to improve conversion rate from chat is to reach out to more customer shopping in real-time with chat campaigns. These automated pop-up conversations can be used to ask whether website visitors need help, know how to qualify for free shipping, or offer a discount.
Research shows that people who use live chat are 3X more likely to complete their purchase before leaving a website.
9)Total sales
How much money is being generated via live chat support? This is simply your total sales made from customers who used your live chat.
How to measure total sales
While you could calculate this manually, in Gorgias statistics you can filter your sales by channel, segmenting only those sales made after a customer used live chat.
Tips to improve total sales
Like your CSAT score, your total sales are a reflection of your overall ability to quickly meet customers’ needs via chat.
Compare individual sales with either very high or very low totals and look for patterns. Do more responses lead to a higher or lower total? Does answering FAQs have an impact? These are important questions that become much easier to answer when you can see the total sales over a given period, agent, channel, request type, and so on.
📚 Read more: Customer Service ROI: How To Measure and Improve Value
10) Automation rate
This is a measure of how many customers are getting help via chat using automated options like self-service order management and quick response flows.
These can be created in the Gorgias chat widget by adding buttons for customers to get information like tracking, or answers to FAQs, without a live agent needing to respond.
For example, luxury jeweler Jaxxon’s chat widget contains the following self-service options for a proactive customer service approach.

By using automated responses, Jaxxon reduced live chat volume by 17% while lifting on-site conversion rate by 6%.
How to measure automation rate
Gorgias Statistics lets you see how many customers use the automated options you have set up in the chat service.
Tips to improve automation rate
Set your chat widget up for success by reviewing incoming tickets to determine which common inquiries can be satisfied with either self-service order management or quick answer flows.
11) Template usage
Templated responses in live chat save your support agents time and, of course, give quicker responses to customers.
At Gorgias, these pre-written responses are called Macros. They are similar to custom fields and they can help automate some of your communication within your live chat support operations.

Preparing Marcos for use in live chat will improve your average response time, resolution time, and lead to more one-touch tickets.
How to measure template usage
In Gorgias Statistics, you can see how often Macros are used in responses to customers.
Tips to improve template usage
Monitoring which types of responses take the most amount of time for agents to resolve will help you create new templates for them to use. On the flip side, seeing a template is used very frequently could point to shortcomings elsewhere.
For example, if you notice that the shipping macro seems to be over-used, you can link out to shipping details and/or update your shipping policy page to make the information easier for customers to find. Then, you may not need to reply to as many tickets in the future.
12) Chat campaign responses
Your chat widget can do so much more than track orders. With Gorgias’ live chat, you can set up campaigns that deliver customized messages for different scenarios.
For example you can set up chat automated chat messages that:
- Offer a product-specific offers or discounts
- Give a link to a style quiz
- Spark conversation around specific products
- Offer a personal, virtual stylist
- Prevent cart abandonment
For example, here’s a chat campaign from Jaxxon to recommend “VIP level support.”

It’s great to try new things with your chat widget but you should always be mindful to measure and evaluate their results.
How to measure chat campaign responses
The best way to track responses to your campaigns is to set up an auto-tag in the Gorgias help desk to see how many people respond when prompted with a campaign message.
Here’s how Jaxxon could set up auto-tagging for the above campaign:

Tips to improve campaign responses
All chat campaigns should be tracked with performance metrics to determine if they were successful, how they can be improved on next time, and if you need to do further A/B testing.
In the Gorgias dashboard, you can:
- Track overall revenue generated by a campaign
- Measure increase in sales for products targeted with a chat campaign
- Track the usage of promo codes
You can also include a UTM link to track clicks.
13) Missed chats
The whole point of live chat is to provide immediate customer service in real-time. Missing a chat has a deep impact on that customers’ satisfaction so you need to keep a keen eye on missed messages in the chat queue and use them to inform your customer service strategy.
How to measure missed chats
Simply review your incoming chats on a regular basis, even daily, to see if any incoming chat sessions didn’t receive a response. Keep track of this number and see if you can get it to the ideal number: zero.
Tips to improve missed messages
As we discussed before, it’s vital to set your business hours in your live chat. For after-hours, include a contact form so that even if you’re not online at the time, a ticket is created.
If you notice you’re missing a lot of chat messages at a particular time of day, or day of the week, that’s an indication to rethink your live chat agent staffing schedule.
You should also pay attention to each individual agent and if they’re missing tickets. That could mean there’s a need for additional training to improve agent performance.
Never stop optimizing
What’s up with your ecommerce live chat support operations? If you don’t know, you can never optimize your processes.
A live chat will only drive sales if it’s being used in a way that best supports both your business and your customers. Keeping a close eye on all the above data will allow you to finetune your live chat performance.
Remember, satisfied customers are loyal customers, and loyal customers are ones that will come back again and again.
Gorgias puts this important data at your fingertips. Our customers can see everything they need to nurture outstanding customer support strategies. Sign up for your free trial today and experience the difference.