
.png)
Inside the Benchmark: How Gorgias Built a Real Test for Ecommerce AI Agents
An interview with Max Pruvost, Gorgias SVP of Product, the engineer behind the Gorgias AI Agent Benchmark.
Everyone evaluating an AI agent today is working from a different scorecard.
Gorgias wanted something a buyer could actually interrogate, so we built one. The AI Agent Benchmark tests AI agents on 200+ live ecommerce stores, has evaluated more than 8,000 conversations, blind-scores the quality of each one against a public rubric, and ranks 12 vendors over a rolling 90-day window.
We sat down with Max Pruvost, the engineer who built the benchmark, to talk about why the standard was needed, how it actually works, and what it took to make the numbers reliable and unbiased.
Most vendors publish some kind of AI performance number. Why wasn't that enough?
Max: Because the numbers don't mean the same thing. "Automation" can mean resolved, contained, or merely answered. The customer might have gotten what they needed, or they might have been pushed to a contact form, and both get counted the same way. "Fast" can mean the first word of a response or the complete answer; those are wildly different experiences for a shopper. And the way that vendors rate quality has been subjective or not at all standardized.
We wanted a single rubric, applied identically to everyone, that describes the two jobs an ecommerce AI agent actually has: helping a shopper buy, and resolving support without needing to pass it off to a human because the team is busy dealing with more complex tickets.
Why split shopping and support instead of one score?
Max: A storefront assistant does two very different jobs, and they punish different weaknesses. A shopping conversation is revenue-critical and impatient. If the recommendation takes twenty seconds, or the shopper can’t get a good recommendation at all, they’re gone. If the buyer doesn’t feel confident about their purchase decision, the agent hasn’t done its job. It’s important that shoppers get all their questions about the product and the brand’s policies answered quickly and accurately, before they drop off.
A support conversation is about containment: did the customer get their refund question answered without anyone touching a ticket? Speed matters far less there.
If you average the two, a vendor that's excellent at policy answers and useless at recommending products can look identical to one that does both. So the benchmark measures the two lanes separately and weights them differently: shopping is 40% automation, 35% quality, 25% speed; support is 50% automation, 40% quality, 10% speed.
Walk us through how a conversation actually gets captured.
Max: Every conversation runs against the live widget on a real storefront, using the same AI deployment customers actually interact with. Each conversation starts completely fresh, with no browsing history or prior context, and our test shopper types every question in its own words. That matters: quick-reply buttons can trigger canned answers that make speed and automation look better than they really are.
The questions are deliberately hard: compound, multi-constraint, and built on earlier answers, with objections and edge cases along the way. Support scenarios include things like splitting a refund between a gift card and credit card or changing an address mid-transit. Shopping scenarios go from open-ended discovery through comparison and objections, all the way to add-to-cart.
Quality is where benchmarks usually become opinions. How did you make the judge trustworthy?
Max: We made three design decisions to make it more trustworthy.
First, blindness. Before judging, we strip out vendor and store identity, so the judge sees behavior, not brands. The information that links a conversation back to its vendor is kept separate and never reaches the judge.
Second, each lane's rubric breaks down into simple yes/no checks, twenty-six of them across the two lanes. The LLM judge answers yes or no per check, and the score out of 100 is calculated from those answers by a fixed formula. A judge can't "feel" an 82.
Third, every passing check must quote the actual transcript, and the quote is verified against the stored transcript in code, an invented quote is demoted to a fail. And the objective parts are even stricter: whether a reply really contains a price, a link, a review quote or a product option is detected by code straight from the transcript, not judged by feel.
Automation rate is the headline metric for most buyers. How is yours different?
Max: The benchmark counts a conversation as automated only when the AI handled it with zero human touch, no handover to a person, and no deflection out of the channel. No "email us," no contact form, no "call us." If more than half of an agent's replies in a conversation push the customer out of the channel, we count the conversation as unresolved.
And importantly, the questions are designed so no turn ever asks for a human. Any handover the AI initiates is its own choice, attributable to a capability gap, not a scripted escape hatch. Also: early bails count against the vendor, and broken widgets are reported separately, never silently dropped or scored as zero. None of that flatters anyone. It's the same measure for every vendor.
Making the methodology fully public is unusual. Why do it?
Max: Because a competitive benchmark nobody outside can check is only an assertion. The rubric is downloadable; the scoring rules, quality gates and neutrality policies are documented. Every scoring decision is written into code as a separate, tested rule, 145 of them, and before any board goes live an automated check blocks it from publishing if it breaks its own rules. The whole thing runs automatically every day: capture, judge, audit, verify, publish. No vendor-specific store exclusions exist.
We would rather someone find a flaw in our method than trust a number they can't inspect. The point is not that our methodology is beyond debate, the point is that the debate should happen around a visible, repeatable standard instead of around marketing claims.
What should a buyer take away from all this?
Max: Three things. First, demand the definition behind every number, what counts as automated, what stops the latency clock, who picked the quality score. Second, configuration beats model: the same vendor scores well on one store and near zero on another, so the deployment you'd actually run is what matters, and testimonials and demos hide that. Third, the most common failure in the field isn't a wrong answer, it's a wall or a loop: authentication demands, repeated clarifying questions, handing everything to a human. Those are guardrail problems, and they're cheap to fix once you can see them.
The full methodology, rubric and live scoreboard are public at evals.gorgias.com. Every number in this piece comes from the September 9, 2026 board, ranked over its 90-day window.
TL;DR:
- Gaia for Zendesk is a free Chrome extension that analyzes your Zendesk ticket history and identifies gaps in your AI Agent setup.
- It generates ready-to-review guidances, instructions, voice-of-customer analysis, and Copilot procedures — nothing is applied without your approval.
- Install it in five minutes and run your first analysis in under a minute.
Getting more out of your Zendesk AI Agent comes down to better configuration. The problem is that auditing your own setup requires time you don't have.
Gaia for Zendesk is a free Chrome extension from Gorgias that clears that backlog in minutes. It connects to your Zendesk account, reads your tickets, and generates the components your AI Agent needs to resolve more conversations without escalation.
Below, you'll find everything you need to get started: how to install Gaia, what it can do, and the use cases teams are already putting it to work for.
Jump to:
- Who is this for?
- What is Gaia for Zendesk?
- Why use Gaia instead of configuring it yourself?
- How to install Gaia for Zendesk
- Four ways to use Gaia for Zendesk
Who is this for?
Zendesk Suite admins and agents who want to set up or improve their Zendesk AI Agent (and, optionally, Zendesk Copilot).
Throughout this article, "AI Agent" refers to Zendesk's own AI Agent feature, not Gorgias's product. Gaia is the Gorgias-built Chrome extension that helps you configure it.
What is Gaia for Zendesk?
Gaia for Zendesk is a free Chrome extension built by Gorgias that connects to your Zendesk account and analyzes your real ticket history.
It autonomously transforms that data into the core components your Zendesk AI Agent needs to resolve more tickets without human intervention: guidances, instructions, voice-of-customer insights, and Copilot procedures.
Gaia opens automatically as a side panel on any .zendesk.com page. You choose a workflow, Gaia runs the analysis and generates structured drafts, and you review and approve what should be applied to your Zendesk workspace.
What Gaia can do:
- Improve your Zendesk AI Agent: Scans escalated tickets, identifies gaps in your existing setup, and proposes targeted updates to your guidances.
- Create your first instructions: Generates 15 best-practice AI Agent instructions, adapted from Gorgias templates and tailored to your ticket data.
- Analyze your tickets: Produces a voice-of-customer report covering ticket volume, intents, and escalation patterns from the last 90 days.
- Create your first procedures: Drafts 10 Copilot procedures using the Gaia WHEN/IF/THEN format (requires the Copilot add-on in Zendesk).
Good to know: Gaia is autonomous in how it analyzes your data and generates recommendations, but nothing is applied without your approval.
Why use Gaia instead of configuring it yourself?
How well your AI Agent performs comes down to how well it is configured. Clear instructions, well-defined intents, and up-to-date procedures are what separate an AI Agent that resolves tickets from one that escalates them — and building that foundation manually takes time most teams do not have.
Gaia removes that constraint by turning your existing support data into structured, ready-to-review outputs:
- Skip the blank page. Start from drafts generated from your own ticket history instead of building from scratch.
- Get from setup to first results faster. Gaia analyzes up to 90 days of tickets in minutes and produces implementation-ready content, so you move from setup to value in hours, not weeks.
- Stay in control. Every output is surfaced for review so you can validate accuracy and alignment with your policies.
- Keep improving over time. Re-run Gaia regularly to capture new intents, identify gaps, and maintain coverage as your business evolves.
Tip: Teams that define five or more strong guidances typically see a meaningful lift in the share of tickets their AI Agent resolves without escalation. Gaia is designed to help you reach and expand beyond that baseline quickly.
How to install Gaia for Zendesk
Installation takes about five minutes. You'll need admin access to your Zendesk account to generate an API token.
Make sure you're using Google Chrome or another Chromium-based browser (such as Edge or Brave). Gaia is not available for Safari or Firefox at launch.
Follow these steps:
1. Install the Gaia for Zendesk extension. Go to the Chrome Web Store listing for Gaia for Zendesk by Gorgias and click Add to Chrome. Confirm the permissions to complete installation.
2. Generate a Zendesk API token. In Zendesk, navigate to Admin Center › Apps and integrations › Zendesk API. Enable Token access if needed, then click Add API token. Copy and store the token securely (it will not be visible again).
3. Open the Gaia extension and add your credentials. Click the Gaia icon in your Chrome toolbar, then open Settings. Enter:
- Zendesk subdomain: the part before .zendesk.com in your account URL (for example, acme if your URL is acme.zendesk.com).
- Email: the email of the Zendesk admin who created the API token.
- API token: paste the token you generated in step 2.
4. Click Save. Gaia will validate the connection.
5. Open any Zendesk page. Navigate to any page in your Zendesk account. Gaia will appear as a side panel where you can select a workflow and begin.
Four ways to use Gaia for Zendesk
Here are the four most common ways teams use Gaia for Zendesk.
1) Audit and improve an existing AI Agent setup
Best for: Teams already using Zendesk AI Agent or Answer Bot but not reaching their automation goals
Select Improve my AI Agent. Gaia analyzes escalated tickets against your current guidances to identify missing intents, unclear instructions, and outdated logic, then proposes prioritized improvements.
2) Bootstrap AI Agent from a blank slate
Best for: Teams starting without an established AI configuration
Select Create my first instructions. Gaia generates a foundational set of 15 instructions covering common ecommerce scenarios (order status, refunds, cancellations, shipping, returns).
3) Run a voice-of-customer analysis
Best for: Support, CX, and operations teams planning improvements or reporting on performance
Select Analyze my tickets. Gaia summarizes ticket volume, top intents, and escalation drivers to highlight where automation or process improvements will have the greatest impact.
4) Roll out Copilot procedures
Best for: Teams using Zendesk Copilot who want consistent, scalable agent workflows
Requires the Copilot add-on in Zendesk. Select Create my first procedures. Gaia converts real agent behavior into structured WHEN/IF/THEN procedures that standardize how common scenarios are handled.
Your AI Agent is resolving less than it should — and it’s costing you
Gaia connects to your Zendesk account, reads your ticket history, and shows you exactly where your setup is falling short. Install the free Chrome extension and run your first analysis in under a minute.

Newsletter Signup
The best in CX and ecommerce, right to your inbox
Featured articles
Ticket Volume: How to Measure It, Benchmark It, and Reduce It
TL;DR:
- Ticket volume is your support workload: It counts every customer inquiry across every channel in a given time period.
- High volume signals friction in your business: Spikes usually point to unclear policies, product issues, or gaps in your website experience.
- Every ticket has a real cost: Agent time, tooling, and overhead add up fast — and they compound during peak seasons.
- Automation reduces volume without reducing quality: AI tools and self-service deflect repetitive questions while keeping customers satisfied.
- Measurement drives improvement: Tracking volume by channel, category, and time period reveals exactly where to focus your efforts.
Your ticket volume number is probably wrong. If customers are reaching you through email forwards, Slack DMs, or channels that bypass your helpdesk, those tickets aren't being counted, and your SLA reporting is built on incomplete data. This guide covers how to get an accurate count, break it down by channel and category, and use your vertical benchmark to figure out whether your volume is actually a problem or just normal for your industry.
What is ticket volume?
Ticket volume is the total number of customer inquiries your support team receives across all channels — email, live chat, phone, social media, and contact forms — within a specific time period. It is the most direct measure of your team's workload.
Do not confuse it with contact rate. Contact rate = tickets ÷ orders (or customers). That normalized number is more useful for benchmarking and planning because it accounts for business growth. Raw ticket volume tells you how busy your team is. Contact rate tells you whether support demand is outpacing your business.
How to calculate your ticket volume
Start by looking at the last 30 days of customer conversations, no matter where they currently live.
Pull these four numbers:
- Total customer questions received across all channels
- Breakdown by channel (email, chat, social DMs, phone, contact forms, etc.)
- Breakdown by category (shipping, returns, product questions, account issues)
- Tickets or conversations per order during the same period — this gives you your contact rate baseline
Here’s how to pull that data depending on your setup:
Gmail or Outlook
Open your inbox or Sent folder and filter by the last 30 days. Count how many customer conversations came in during that period. You can also copy subject lines into ChatGPT or Claude to group conversations by topic.
Shopify Inbox
Go to Inbox > Conversations and review your recent conversations. Count how many messages you received and look for repeated themes or questions.
Any helpdesk (Gorgias, Zendesk, Freshdesk, Help Scout, etc.)
Most helpdesks have ticket reporting or exports built in. Search “export tickets” or “ticket report” in your platform’s help center. From there, you can pull:
- Total tickets
- Channel breakdown
- Top ticket categories
- Tickets over time
If a large portion of customer questions are still happening in untracked places like Slack DMs, personal inboxes, or Instagram comments, your reporting is incomplete. Before optimizing support operations, route customer conversations into one shared system so you can accurately measure volume, response times, and recurring issues.
Why your volume breakdown matters more than the total
A raw ticket count tells you how busy your team is. The breakdown tells you what to fix.
|
Category |
What high volume signals |
What to do |
|
"Where is my order?" |
No proactive shipping updates; poor tracking page |
Automate WISMO with AI Agent; add tracking link to order confirmation |
|
Returns and exchanges |
Confusing return policy; no self-serve portal |
Add a clear returns page; enable self-serve exchange flows |
|
Sizing and product questions |
Weak product page content |
Add size guides, FAQs, and fit notes directly on product pages |
|
Account and subscription issues |
Customers can't self-serve basic account changes |
Build or improve your Help Center; enable self-serve account management |
|
Payment and billing |
Checkout friction or unclear pricing |
Fix at the source — this is rarely a support problem |
Run this categorization for your last 30 days. Your top two or three categories are your highest-leverage targets.
Track volume alongside these KPIs
Ticket volume only tells part of the story. Track it alongside:
- Contact rate (tickets ÷ orders) — so you know if volume is growing faster than your business
- First response time (FRT) — volume spikes show up here first
- Average handle time (AHT) — high AHT + high volume = a capacity problem
- Cost per ticket — total support costs ÷ total tickets, the clearest financial measure
- Backlog size — a growing backlog is the earliest warning sign that volume is outpacing capacity
- Deflection rate — tickets resolved through self-service or automation without agent involvement
How to reduce ticket volume without reducing quality
Once you know what is driving your volume, address each category at the source. The goal is to eliminate unnecessary tickets.
Automate the highest-volume, lowest-complexity tickets first. WISMO inquiries, order status checks, and basic return initiations require no agent judgment. An AI Agent connected to your ecommerce platform can handle these end-to-end without a human stepping in. When a question is too complex, the AI escalates it with full context attached.
Build self-service content around your top categories. A Help Center that directly addresses your most common ticket types is the highest-leverage tool for sustained volume reduction. Start with your top five categories. Write one article per category. Surface those articles on relevant product pages, in checkout, and in post-purchase emails — before customers need to search.
Send proactive messages at the moments that generate the most tickets. Post-purchase is the single highest-value touchpoint: an order confirmation that includes a tracking link, estimated delivery window, and a clear link to your return policy eliminates a large share of inbound questions before they are ever submitted.
Measure deflection, not just volume. Deflection rate, the percentage of issues resolved through self-service or automation, is the metric that tells you whether your volume reduction efforts are actually working. Track it weekly alongside CSAT for automated interactions to make sure quality is holding.
Ticket volume benchmarks
The all-industry average is not your benchmark. Ticket volume per 100 orders varies 2.4x across verticals, so comparing yourself to a cross-industry number will either make you complacent or create false urgency.
According to Gorgias platform data from March 2026 across 14 verticals at the $10M GMV band, here is what tickets per 100 orders actually looks like by vertical:
|
Vertical |
Tickets per 100 orders |
|
Electronics |
46 |
|
Vehicles & Parts |
46 |
|
Hardware |
41 |
|
Luggage & Bags |
32 |
|
Home & Garden |
32 |
|
Sporting Goods |
32 |
|
Baby & Toddler |
24 |
|
Business & Industrial |
25 |
|
Animals & Pet Supplies |
25 |
|
Apparel & Accessories |
22 |
|
Health & Beauty |
21 |
|
Arts & Entertainment |
21 |
|
Food & Beverages |
20 |
|
Toys & Games |
19 |
Source: Gorgias Ecom Lab, March 2026
High ticket volume is not always a sign of poor CX — it often reflects product complexity. Electronics brands generate nearly one ticket per two orders because customers have more pre- and post-purchase questions about technical products. Food and Beverage brands generate about one in five. That gap is not a performance difference; it is a category difference.
The right question is not "are we below 10 tickets per 100 orders?" It is "are we above or below our vertical peers?" Find your row. That is your baseline. Then use the reduction tactics above to move below it.
How to predict ticket volume if your tool charges per ticket
If your ticketing tool uses usage-based pricing, where your bill scales with ticket volume rather than agent headcount, forecasting volume directly affects your budget.
The core formula is simple:
Projected tickets = projected orders × (tickets per 100 orders ÷ 100)
So if you expect 2,000 orders next month and your vertical median is 22 tickets per 100 orders, your forecast is approximately 440 tickets.
But a flat monthly estimate misses the real risk: peak seasons. A volume spike during BFCM that triples your order volume will also triple your ticket count — and your bill — unless you have guardrails in place.
To build a more accurate forecast:
- Use your contact rate, not raw volume. Divide your tickets by orders for each of the last 12 months. This gives you a stable ratio that accounts for business growth and seasonal swings.
- Apply that ratio to your order forecast. If your marketing team has a sales projection for November, multiply it by your contact rate to estimate support volume.
- Separate your AI-handled tickets from agent-handled tickets. Some platforms bill differently for automated resolutions versus human ones. If you're using an AI Agent to deflect WISMO and returns, those deflected tickets may not count toward your billable volume at all — which changes the math significantly.
- Build in a buffer for peak periods. Your contact rate tends to rise during high-demand periods, not just your order volume. First-time customers generate more tickets than repeat buyers, and BFCM brings a disproportionate share of first-timers.
Before signing any usage-based contract, ask two questions: What counts as a billable ticket? And is there a hard cap on monthly charges? Variable billing only works in your favor if you have clear definitions of what triggers a charge and a ceiling on how high costs can go during an unexpected spike.
If your platform bills per ticket resolved by a human agent (not AI), your deflection rate becomes a financial metric, not just an operational one. Every percentage point of additional deflection directly reduces your bill.
Start reducing ticket volume today
Begin by identifying your top ticket categories, then work backward to find the root cause of each one.
From there, layer in self-service content, automation, and proactive messaging to address those root causes directly. The result is a support operation that handles more customers and a team that spends its time on the work that actually requires human judgment.
Book a demo to see how Gorgias helps ecommerce brands reduce ticket volume and improve customer experience at the same time.
{{lead-magnet-2}}
Gorgias AI Agent Pricing, Explained
TL;DR:
- AI Agent is priced per resolved interaction, not per seat or per message. You only pay when the AI fully resolves a conversation on its own.
- Most plans are $0.90 per resolved interaction. Starter plans begin at $1. Plans include 90 to 2,500+ automated interactions per month.
- If you go over your plan, overage fees apply per additional interaction. Rates vary by tier and are lower on annual plans.
- Your automation rate emerges from usage over time. Start by estimating your ticket volume and pick an interaction allotment that fits.
- AI Agent runs on email, chat, and SMS, and includes tone of voice customization, Actions, multi-language support, vision, and performance reporting.
If you're wondering what it costs to add AI Agent to your Helpdesk, you're in the right place. This article walks through how pricing works, what counts as a billable interaction, and how to think about the investment before talking to anyone on our team.
The good news: there are no seat fees, no per-message charges, and no token-based billing. You pay for conversations your AI actually resolves. If you've looked into other AI tools for customer support and found the pricing models confusing or hard to predict, Gorgias AI Agent works differently.
What is a billable interaction?
A billable interaction is counted when the AI resolves a customer conversation entirely on its own. The customer asks something, the AI handles it, the conversation closes. That's one interaction.
If the AI can't fully resolve a conversation and hands it to a human agent, that ticket shifts over to your regular Helpdesk plan. It becomes a standard resolved ticket. You're not charged for both.
A few things that don't count as billable interactions:
- Emails that come in but no one replies to
- Spam or filtered messages
- Conversations resolved by a human agent
This matters most for brands coming from seat-based tools. With Gorgias, your whole team can work in the platform. Agent seats are unlimited. Pricing scales with what your AI is actually doing, not with how many people have access.
Understand the difference between seat-based vs. usage-based pricing.
How AI Agent plans work
AI Agent is an add-on to your Gorgias Helpdesk plan. The two are priced separately but work together. Your Helpdesk plan covers all the conversations your human agents resolve. Your AI Agent plan covers the interactions the AI resolves on its own.
When you choose a plan, you select how many automated interactions you want included per month. Depending on your plan, that ranges from 90 to 2,500+ interactions, with custom interaction numbers available for enterprise. You can see the full breakdown on the Gorgias pricing page.
Each resolved conversation costs $0.90 on most plans. Starter plans begin at $1 per resolved conversation. You only pay for fully automated interactions, meaning conversations the AI handles from start to finish without a human stepping in.
Choosing the right plan
The main input is your average monthly ticket volume. From there, you estimate how many of those conversations AI could realistically handle on its own.
Order status updates, return requests, and shipping questions tend to be the highest-volume ticket types AI resolves well. AI Agent actions shows the full range of what it can handle, which makes it easier to estimate your starting number.
Your actual automation rate, meaning the share of total tickets the AI ends up resolving, emerges from usage over time. Most brands start with their most repetitive ticket types and expand from there as they see results.
Related: Which Gorgias plan should you choose?
What happens if you go over your plan
You're charged an overage fee for each additional automated interaction if you exceed your plan's baseline in a given month. The exact rate depends on your plan tier and whether you're on a monthly or annual subscription.
Generally, the higher your plan tier, the lower your overage rate. Annual plans also carry lower overage rates than monthly plans. So if you're regularly going over, upgrading to a higher tier or switching to annual often works out cheaper than paying overage fees month after month.
If you're on a Support + Shopping Assistant plan, the overage rate is $1.50 per interaction across all paid tiers. If you're on a Support-only plan, rates range from $1.00 to $2.00 per interaction on monthly plans, and $0.83 to $1.67 on annual plans, depending on your tier.
For seasonal businesses, forecasting your customer service volume before peak periods is the best way to choose the right plan size and avoid unexpected fees.
How to think about the cost
At $0.90 per resolved interaction on most plans, each AI resolution costs less than a human agent handling the same ticket. Once you know what a human-resolved ticket costs your business, the comparison becomes straightforward.
For brands building an internal case for the investment, how to pitch AI Agent to your boss covers the ROI framing in detail.
To see what results look like in practice, how 10 brands transformed customer support into revenue has real ecommerce examples.
What's included with AI Agent
AI Agent comes with everything you need to set it up, customize it, and improve it over time:
- Knowledge training — AI Agent learns from your Shopify data, store website, Help Center articles, URLs, documents, and custom guidance. The more content it has, the more accurately it responds.
- Tone of voice — set instructions for how AI Agent sounds, whether that's professional, friendly, or something else, and it stays consistent across every conversation.
- Actions — connect AI Agent to your other tools so it can complete tasks like cancelling an order, processing a return, or modifying a subscription without a human stepping in. See what AI Agent can do.
- Multi-language support — AI Agent detects the language a customer writes in and replies in the same language automatically.
- Vision — AI Agent can read and understand images, so it can handle tickets where customers share photos of damaged items or order issues.
- Performance reporting — track automation rate, CSAT, first-response time, and ticket topics directly in the dashboard.
- Testing — preview how AI Agent responds to real customer questions before going live or after making changes.
- Handover to humans — AI Agent automatically passes conversations to your team when it lacks confidence, detects frustration, or encounters a topic you've marked for human handling.
Learn more: Gorgias AI Agent guardrails: What they are and how to configure them
Curious what AI Agent would automate for your store?
The best way to get a sense of what AI Agent will cost is to look at your own ticket volume and the types of questions your customers ask most. From there, the right plan becomes much clearer.
If you want to talk through the numbers with someone from our team, book a demo and we'll walk through it with you.
If you'd rather keep exploring first, here are a few good next reads:
- AI Agent keeps getting smarter — the latest performance data across the Gorgias customer base
- 10 must-know AI Agent use cases — the ticket types brands are automating today
- How 10 brands transformed customer support into revenue — real ecommerce results
- How to customize AI Agent with 7 brand voice examples — what the experience looks like for customers
{{lead-magnet-2}}
Introducing Helpdesk 2.0: Built for How Agents Work
TL;DR:
- Built directly from agent feedback, Helpdesk 2.0 fixes real workflow pain points. The redesign focuses on reducing friction and helping agents handle more context-heavy tickets.
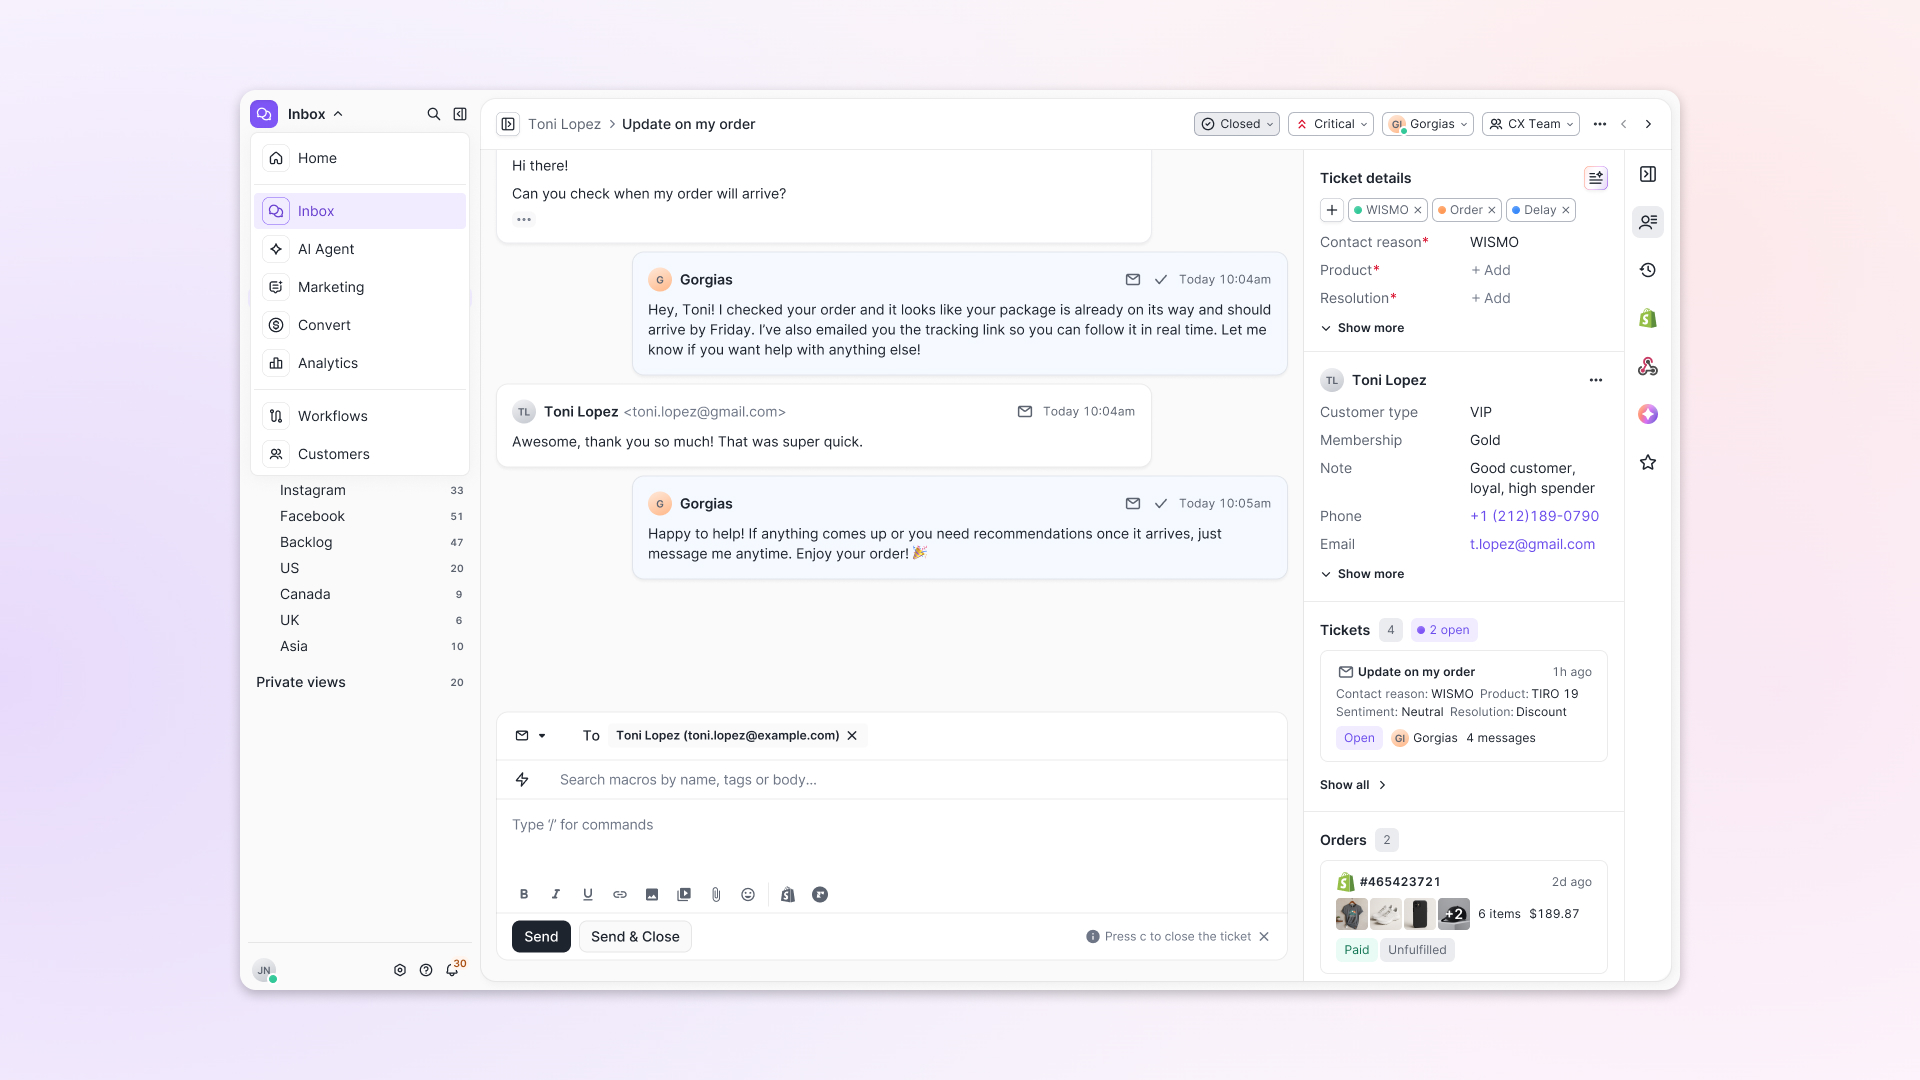
- A chat-style interface replaces the old email layout. Conversations are easier to follow and resolve in one view.
- Customer context is shown beside the conversation in a right-side panel. Agents can view history, orders, and details without leaving the ticket.
- AI handoffs come with clear summaries. Agents instantly see what happened, what was tried, and what to do next.
- Navigation is simpler and faster across teams. Clean menus, structured queues, and multi-store access keep agents moving efficiently.
Helpdesk 2.0 starts with the people who use it most: the agents.
We spent time understanding customer support from the agent's seat. What do they reach for constantly? What slows them down? What does a better workday look like?
Everything we found is in this brand-new update.
Why we redesigned Helpdesk
Conversational commerce is the new standard.
In customer support, this means customers expect context to remain intact wherever they reach out, whether a conversation starts on social, moves to email, or ends on a call.
This new approach to support has also changed the agent's role. Recurring tickets, like order status checks, shipping updates, and returns, are now handled by AI. What lands in the agent inbox are edge cases that require human judgment and troubleshooting, or tickets that require the full picture.
However, the original Helpdesk was built for a different era of support.
Context was separated across views rather than built into the conversation itself. It's something one in five Gorgias customers flagged, through support tickets, NPS surveys, and conversations with our team. So, we got to work.
Helpdesk 2.0 is the result.
What's new in Helpdesk 2.0
Here's a look at everything that changed.
Read conversations the way they're meant to be read
Conversations have a natural rhythm, one that’s already found in every messaging tool we use. We brought that same layout into the helpdesk.
Say goodbye to the 2000s email interface and hello to chat bubbles. This updated design changes how quickly you can orient yourself and resolve the ticket in one go.
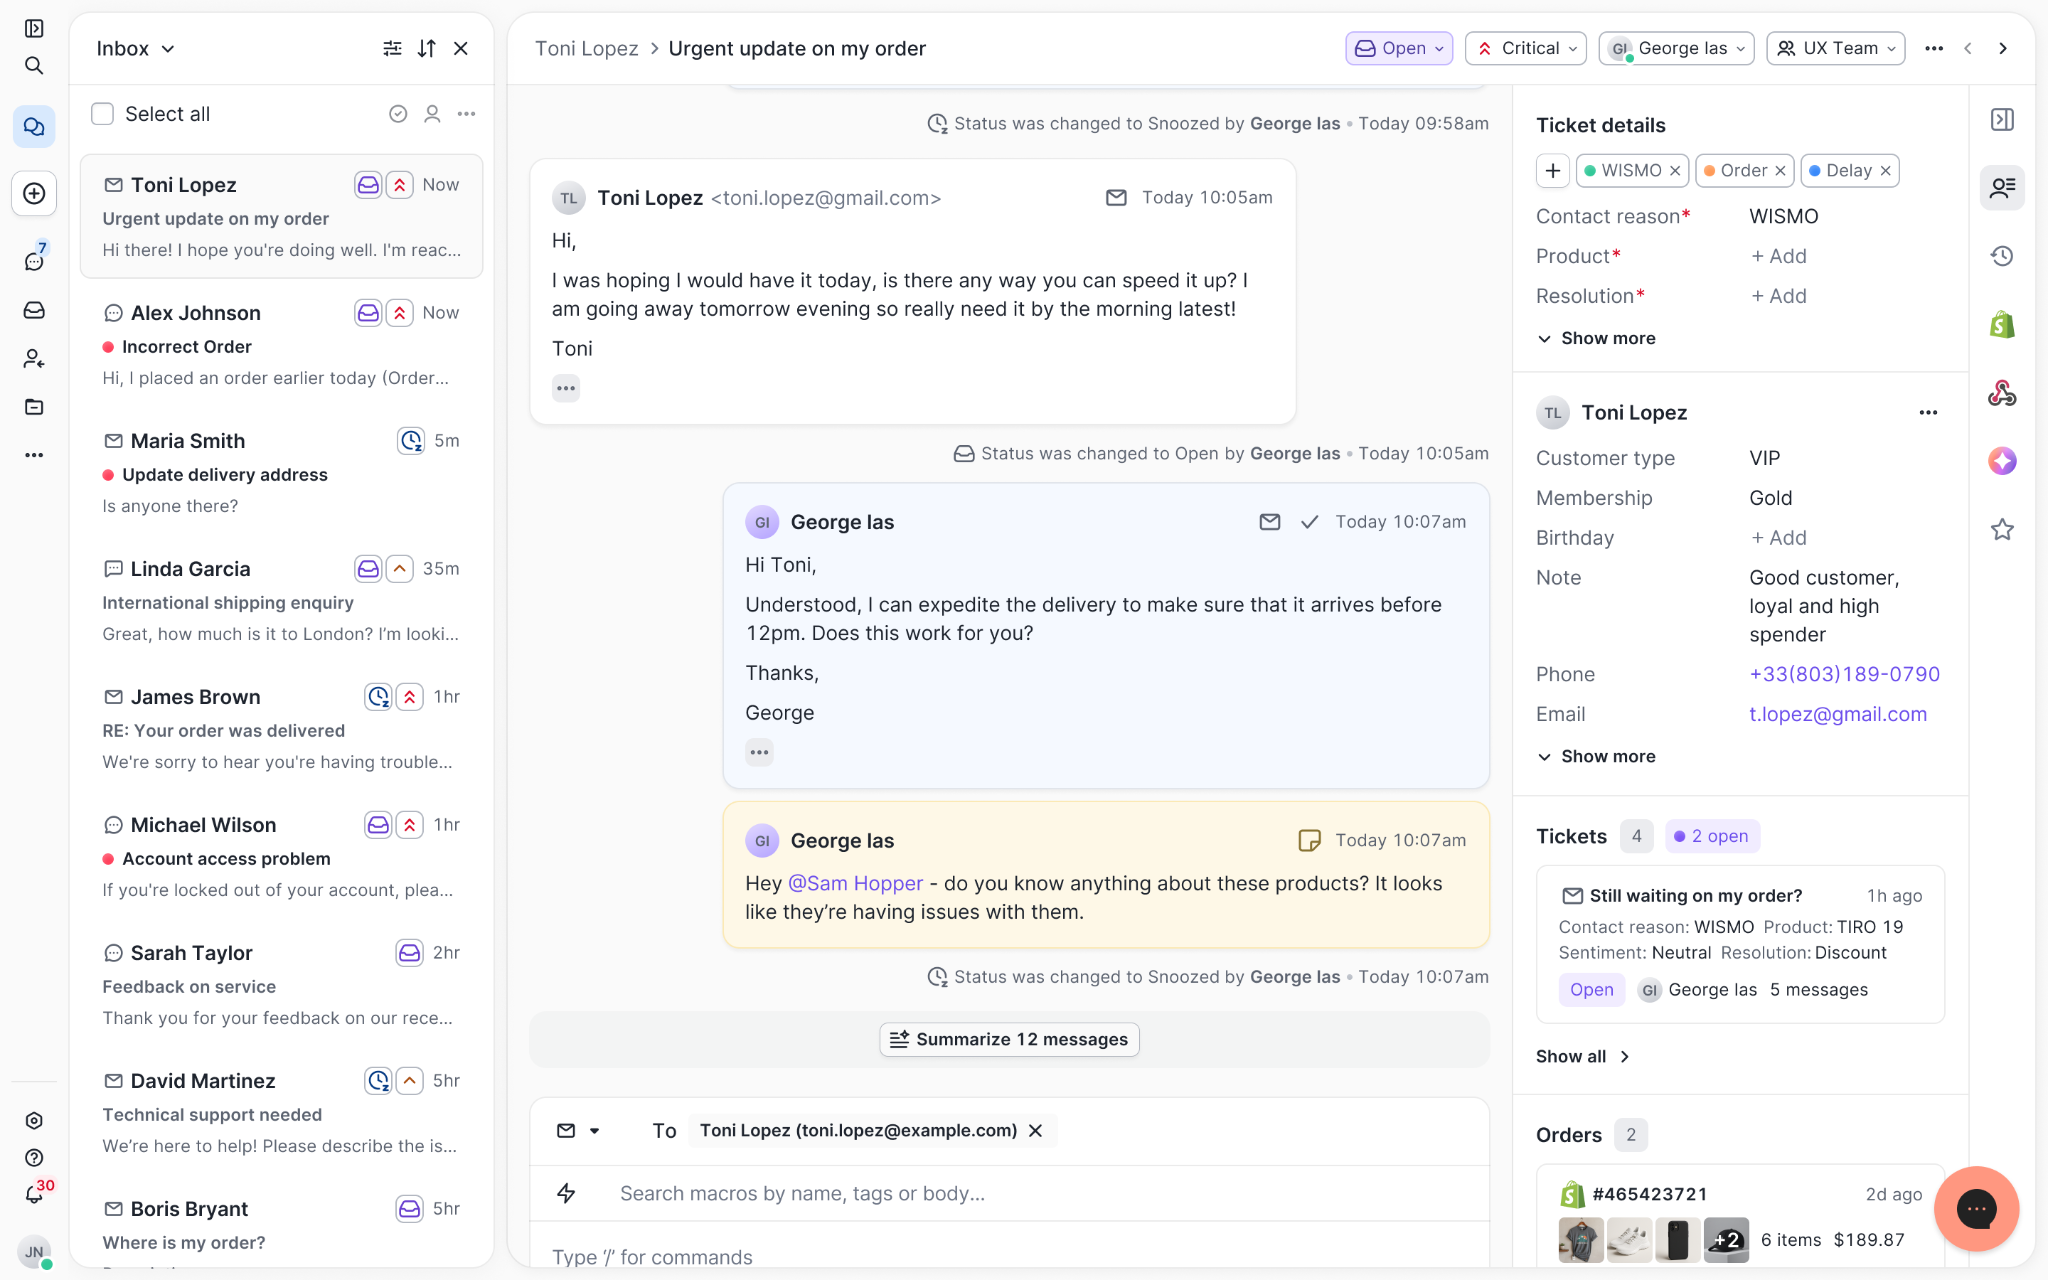
Chats with customers now look like real conversations, using the speech bubble style you’re familiar with on popular messaging apps.
Check customer history without losing your place
Checking a customer's history used to mean leaving the conversation, an extra step that interrupted what should have been a smooth workflow.
Now, past conversations open in a sidebar next to the active conversation. You can view a customer’s full history, search through their timeline, and open prior tickets without going to a new page.

Check past conversations, orders, and customer details in the brand-new Customer Timeline.
See order details the moment you open a ticket
Order information is easier to reference than ever. Open a ticket, and you instantly see the customer's recent orders, marked with product images and invoice details at a glance. Need to dig deeper? Click on an order, and the expanded information appears in the same panel.
For teams using custom integrations, apps are fixed in a quick-access integration menu on the right.
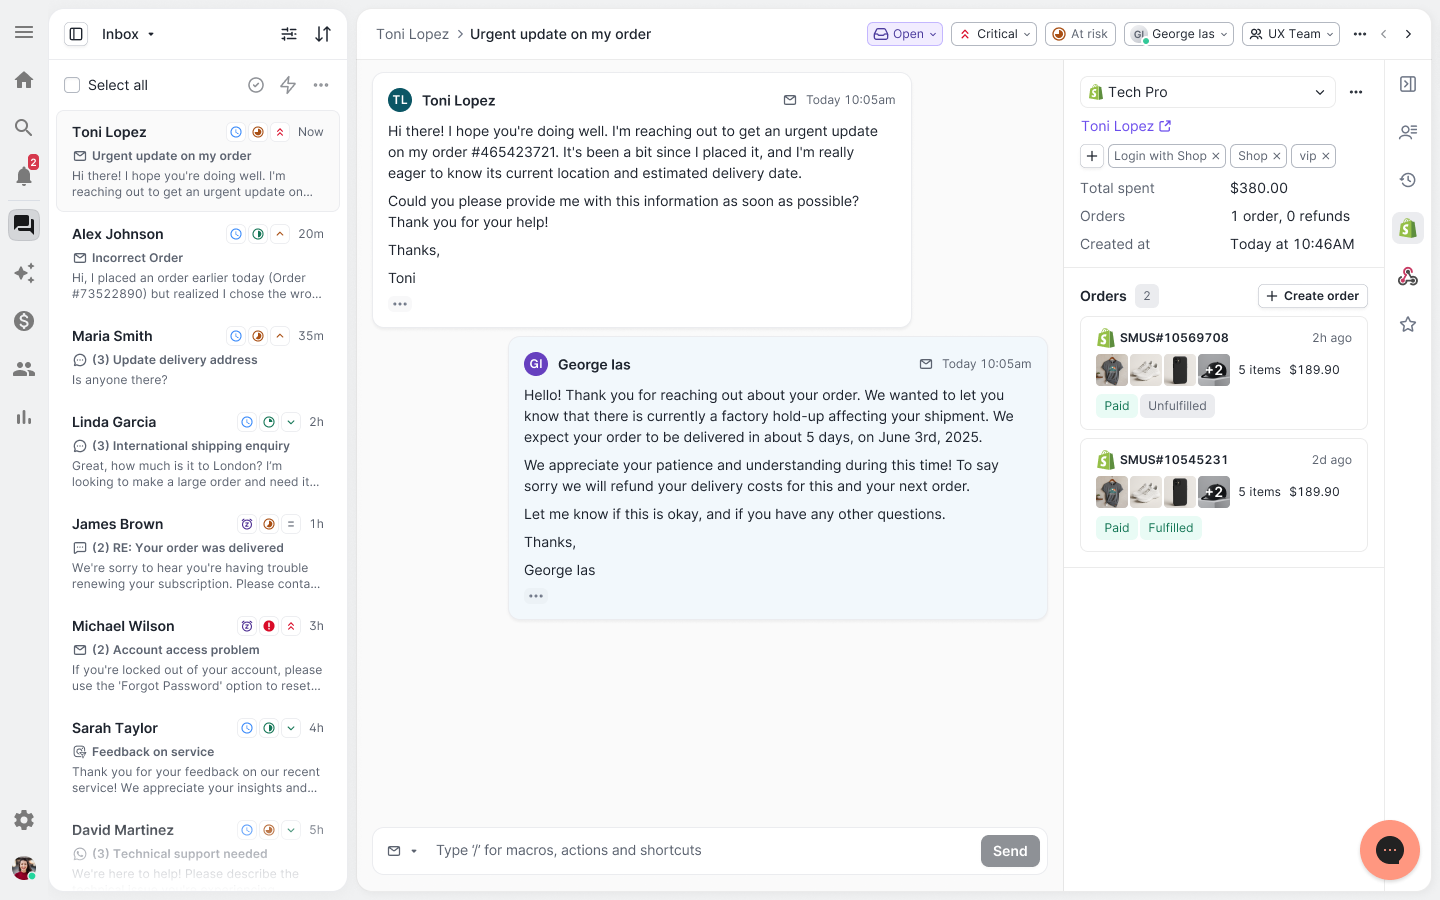
See order details, product images, and totals at a glance on the right panel, without leaving the conversation.
Pick up where AI left off
You shouldn't have to dig through a thread to figure out what AI already tried. Now you don't have to.
When AI Agent escalates a conversation, it includes a concise handover summary that mentions the issue, what actions were taken, and why it was passed to your team.
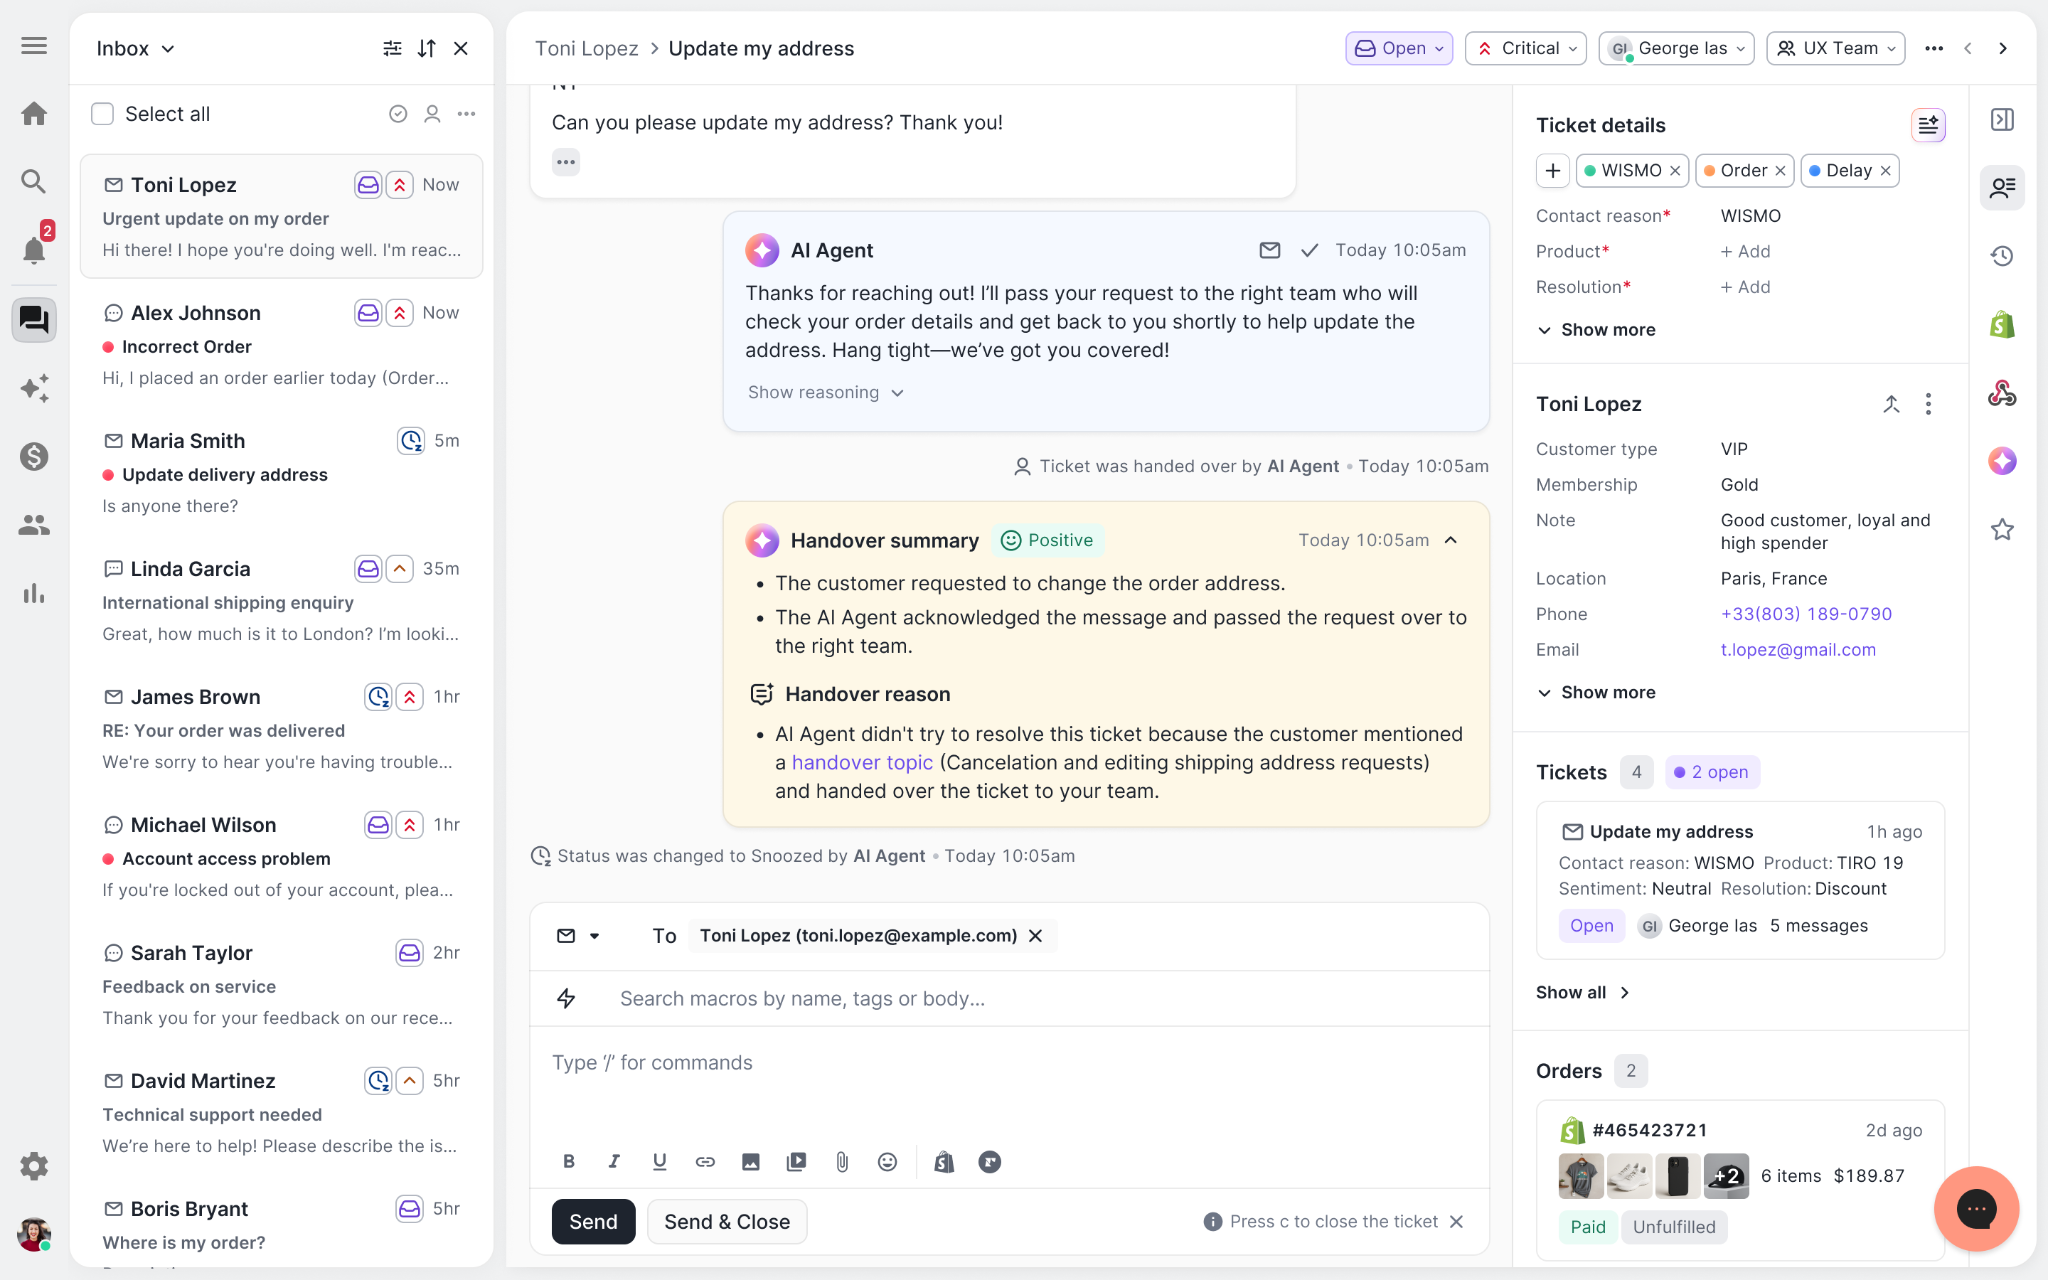
Escalated tickets include a brief AI-generated handover summary, marked in yellow, for quick reference.
Move faster across every store and team
We restructured and simplified the navigation. The left sidebar organizes everything into clear categories: Inbox, AI Agent, Marketing, and Analytics, so anyone on your team knows exactly where to go.
To quickly update your knowledge base or adjust a workflow, both now live right in the sidebar. For teams managing multiple stores, switching between them is just as straightforward, accessible from the sidebar, so agents can move between inboxes without breaking their flow.
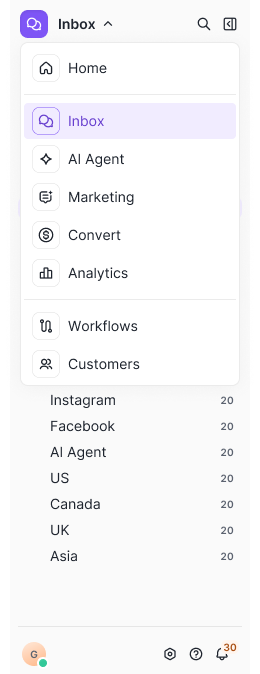
Agents can switch between stores and their corresponding inboxes directly from the left menu.
A workspace that works the way agents do
Support comes down to the person on the other end of the conversation. We built Helpdesk 2.0 is to make sure they have everything they need to show up for that moment.
The best way to see the difference is to work in it. Start a free trial today.
7 CRO A/B Tests to Reduce Customer Support Tickets


Further reading
Gaia for Zendesk: The Free AI Agent Audit Tool
TL;DR:
- Gaia for Zendesk is a free Chrome extension that analyzes your Zendesk ticket history and identifies gaps in your AI Agent setup.
- It generates ready-to-review guidances, instructions, voice-of-customer analysis, and Copilot procedures — nothing is applied without your approval.
- Install it in five minutes and run your first analysis in under a minute.
Getting more out of your Zendesk AI Agent comes down to better configuration. The problem is that auditing your own setup requires time you don't have.
Gaia for Zendesk is a free Chrome extension from Gorgias that clears that backlog in minutes. It connects to your Zendesk account, reads your tickets, and generates the components your AI Agent needs to resolve more conversations without escalation.
Below, you'll find everything you need to get started: how to install Gaia, what it can do, and the use cases teams are already putting it to work for.
Jump to:
- Who is this for?
- What is Gaia for Zendesk?
- Why use Gaia instead of configuring it yourself?
- How to install Gaia for Zendesk
- Four ways to use Gaia for Zendesk
Who is this for?
Zendesk Suite admins and agents who want to set up or improve their Zendesk AI Agent (and, optionally, Zendesk Copilot).
Throughout this article, "AI Agent" refers to Zendesk's own AI Agent feature, not Gorgias's product. Gaia is the Gorgias-built Chrome extension that helps you configure it.
What is Gaia for Zendesk?
Gaia for Zendesk is a free Chrome extension built by Gorgias that connects to your Zendesk account and analyzes your real ticket history.
It autonomously transforms that data into the core components your Zendesk AI Agent needs to resolve more tickets without human intervention: guidances, instructions, voice-of-customer insights, and Copilot procedures.
Gaia opens automatically as a side panel on any .zendesk.com page. You choose a workflow, Gaia runs the analysis and generates structured drafts, and you review and approve what should be applied to your Zendesk workspace.
What Gaia can do:
- Improve your Zendesk AI Agent: Scans escalated tickets, identifies gaps in your existing setup, and proposes targeted updates to your guidances.
- Create your first instructions: Generates 15 best-practice AI Agent instructions, adapted from Gorgias templates and tailored to your ticket data.
- Analyze your tickets: Produces a voice-of-customer report covering ticket volume, intents, and escalation patterns from the last 90 days.
- Create your first procedures: Drafts 10 Copilot procedures using the Gaia WHEN/IF/THEN format (requires the Copilot add-on in Zendesk).
Good to know: Gaia is autonomous in how it analyzes your data and generates recommendations, but nothing is applied without your approval.
Why use Gaia instead of configuring it yourself?
How well your AI Agent performs comes down to how well it is configured. Clear instructions, well-defined intents, and up-to-date procedures are what separate an AI Agent that resolves tickets from one that escalates them — and building that foundation manually takes time most teams do not have.
Gaia removes that constraint by turning your existing support data into structured, ready-to-review outputs:
- Skip the blank page. Start from drafts generated from your own ticket history instead of building from scratch.
- Get from setup to first results faster. Gaia analyzes up to 90 days of tickets in minutes and produces implementation-ready content, so you move from setup to value in hours, not weeks.
- Stay in control. Every output is surfaced for review so you can validate accuracy and alignment with your policies.
- Keep improving over time. Re-run Gaia regularly to capture new intents, identify gaps, and maintain coverage as your business evolves.
Tip: Teams that define five or more strong guidances typically see a meaningful lift in the share of tickets their AI Agent resolves without escalation. Gaia is designed to help you reach and expand beyond that baseline quickly.
How to install Gaia for Zendesk
Installation takes about five minutes. You'll need admin access to your Zendesk account to generate an API token.
Make sure you're using Google Chrome or another Chromium-based browser (such as Edge or Brave). Gaia is not available for Safari or Firefox at launch.
Follow these steps:
1. Install the Gaia for Zendesk extension. Go to the Chrome Web Store listing for Gaia for Zendesk by Gorgias and click Add to Chrome. Confirm the permissions to complete installation.
2. Generate a Zendesk API token. In Zendesk, navigate to Admin Center › Apps and integrations › Zendesk API. Enable Token access if needed, then click Add API token. Copy and store the token securely (it will not be visible again).
3. Open the Gaia extension and add your credentials. Click the Gaia icon in your Chrome toolbar, then open Settings. Enter:
- Zendesk subdomain: the part before .zendesk.com in your account URL (for example, acme if your URL is acme.zendesk.com).
- Email: the email of the Zendesk admin who created the API token.
- API token: paste the token you generated in step 2.
4. Click Save. Gaia will validate the connection.
5. Open any Zendesk page. Navigate to any page in your Zendesk account. Gaia will appear as a side panel where you can select a workflow and begin.
Four ways to use Gaia for Zendesk
Here are the four most common ways teams use Gaia for Zendesk.
1) Audit and improve an existing AI Agent setup
Best for: Teams already using Zendesk AI Agent or Answer Bot but not reaching their automation goals
Select Improve my AI Agent. Gaia analyzes escalated tickets against your current guidances to identify missing intents, unclear instructions, and outdated logic, then proposes prioritized improvements.
2) Bootstrap AI Agent from a blank slate
Best for: Teams starting without an established AI configuration
Select Create my first instructions. Gaia generates a foundational set of 15 instructions covering common ecommerce scenarios (order status, refunds, cancellations, shipping, returns).
3) Run a voice-of-customer analysis
Best for: Support, CX, and operations teams planning improvements or reporting on performance
Select Analyze my tickets. Gaia summarizes ticket volume, top intents, and escalation drivers to highlight where automation or process improvements will have the greatest impact.
4) Roll out Copilot procedures
Best for: Teams using Zendesk Copilot who want consistent, scalable agent workflows
Requires the Copilot add-on in Zendesk. Select Create my first procedures. Gaia converts real agent behavior into structured WHEN/IF/THEN procedures that standardize how common scenarios are handled.
Your AI Agent is resolving less than it should — and it’s costing you
Gaia connects to your Zendesk account, reads your ticket history, and shows you exactly where your setup is falling short. Install the free Chrome extension and run your first analysis in under a minute.

How to Handle Customer Support as a Small Business Owner
TL;DR:
- Managing support across multiple channels without a system is the core problem, not the volume of tickets.
- A knowledge base of your most common questions is the foundation for everything else, from templates to AI tools.
- Automate in layers: start with auto-acknowledgment, then AI-assisted drafts, then full automation only for zero-judgment replies.
- When free tools stop keeping up, a helpdesk connects all your channels and gives you full customer context in one place.
If you're a small business owner handling support solo, you’re familiar with the following: questions coming in from every direction, hours spent typing out replies, and customers waiting days for an answer. What you’re missing is a system that holds it all together.
Below, we’ll walk you through how to build a reliable customer support operation solo, starting with free tools and simple processes, with options to scale as your business grows.
{{lead-magnet-1}}
Why customer support feels overwhelming for small businesses
Running support solo is hard for a few specific reasons:
- Every channel is its own inbox. Instagram DMs, email, WhatsApp — a customer's history is spread across different tools, so every interaction starts with zero context.
- Your best answers live in your head. Until they're written down, no new hire can help without escalating back to you.
- The same questions come in on repeat. Most small businesses find that nearly all of their support tickets are variations of the same handful of questions. Without a system, you're writing the same replies from scratch every time.
- There's no triage. Urgent issues and FAQs land in the same inbox with equal weight, so prioritizing takes judgment and time.
Most of the fixes in this guide address one of those problems directly. The fastest wins come from consolidating where support happens and getting your knowledge out of your head and into a format that works for you, and eventually, for the tools that can help you.
Related reading: Why consolidated doesn’t mean compromised: Top 3 myths debunked
Step 1: Pick one channel and own it
Before adding any tools or automation, identify where the majority of your inquiries come from. Pull a rough count over the last 30 days across your active channels. If one channel tops the list, that's your starting point.
If ticket volume is roughly the same across channels, choose whichever works best for your needs. Which channel lets you respond most effectively? Which one can keep detailed and retrievable records? Where do customers like to receive answers?
A quick overview of the top support channels:
- Email supports longer answers, searchable history, and batching replies, meaning you can respond to 10 emails at once.
- DMs are faster but naturally become back-and-forth exchanges that can turn into lengthy message threads. Most platforms also don’t offer deep search beyond keyword matching.
- Live chat sets response time expectations that are hard to meet without a dedicated support agent.
For most small businesses, email is the stronger primary channel. Once you've chosen yours, redirect everyone to it: a link in your Instagram bio, a WhatsApp auto-reply pointing to your email, or a contact form confirmation that sets response time expectations.
You don't have to abandon your other channels. Just choose one as the place where conversations get resolved.
Related reading: How to implement an omnichannel customer service strategy
Step 2: Build your support knowledge base
The single most helpful thing you can do for your support operation is write down your best answers. Everything else — templates, AI tools, VA training, and customer-facing FAQs — depends on this foundation.
How to build it:
- For one to two weeks, save every reply you send. Paste them into a running Google Doc or Notion page as you go.
- Look for the patterns. Shipping timelines, return policies, pricing questions, order status, and product fit will come up again and again.
- Turn the best version of each recurring answer into a clean, reusable write-up.
Efficiency tip: Use AI to speed this up. Export past support emails, chat histories, or even a rough doc of notes, and paste them into Claude or ChatGPT. Ask it to group recurring questions into categories and draft answers for each. What might take an afternoon of manual work takes just 20 minutes.
Put the knowledge base to work in two ways
Internally: This doc becomes the main reference for anyone or any tool, answering on your behalf. It's the foundation for the canned responses in the next section, and the training material if you ever bring on a new teammate.
Externally: A customer-facing FAQ reduces inquiries before they happen. If a customer can answer their own question at midnight without waiting for you, that's one less ticket in your inbox. Add FAQs to your website footer, a dedicated FAQ page, or directly on product pages for questions specific to that item.
Tip for social-heavy brands: Your FAQ content doesn't have to live only on your website.
- On Instagram, save FAQ content as dedicated Highlights (e.g., "Shipping," "Returns," "Sizing") so customers can find answers without DMing you.
- A pinned post on Instagram or Facebook can address your single most common question before it gets asked.
- On TikTok, pin your most-viewed FAQ-style videos to your profile so new visitors see them immediately.
Step 3: Set up canned responses and templates
Once your knowledge base exists, turn it into templates. This is the fastest operational win available to a one-person support operation.
In Gmail, canned responses let you insert a full reply with two clicks. Set them up for your top five to ten questions, and you'll cut your average reply time significantly. Most other email clients have an equivalent feature.
A few tips for making templates work:
- Start with your highest-volume questions, not your most complex ones. The goal is to reduce time spent on repetitive replies, not to script every possible scenario.
- Treat templates as a starting point. One sentence of personalization, using the customer's name or referencing their specific order, goes a long way toward making your pre-written replies feel human.
- Keep a master doc as your source of truth. Even if you're using Gmail templates, maintain a doc with all your answers in one place. It's easier to update, share, and eventually hand off.
You don’t need a formal template system yet. A Google Doc you copy from is still a real improvement over writing from scratch. Don't wait for the perfect setup.
Step 4: Add automation gradually, in the right order
The instinct when you're overwhelmed is to automate everything at once. The better approach is to layer it in, starting with the lowest-risk options and working your way toward AI tools only once you trust the outputs.
Layer 1: Automatic acknowledgment to set expectations
Set up an immediate reply on every channel that confirms you received the message and gives an expected response time. This one change reduces follow-up messages significantly. Customers don't need an instant answer, they need to know you're there. Most email clients and helpdesks offer this for free.
Layer 2: AI-assisted drafts to reduce time spent typing
Tools that draft a reply for you to review before sending are the right entry point for AI in a small business support operation. You edit instead of write from scratch, which is meaningfully faster, and you stay in control of what goes out. This addresses the most common concern about AI in support: not that it can't help, but that it might say something wrong without you knowing.
Layer 3: Automated replies to reduce follow-ups
Order confirmations, shipping notifications, and return receipts are fully automatable. The answers are always the same, no context is needed, and customers expect them to be automated. Start here before moving to anything more complex.
Layer 4: AI auto-responses to answer repetitive questions
At this point, you trust the accuracy of your knowledge base and are comfortable with how your AI tool responds to customers. Now, you can consider letting it automatically respond to straightforward FAQs.
Be transparent about it. A simple label like "Hi, I'm a support assistant" sets the right expectation and reduces frustration if the answer misses. Only apply this layer when the previous three are working reliably.
What to look for when you're ready for a helpdesk
Free tools can only do so much. When other parts of your business end up being neglected because of all the time you spend on support, it’s time to move to paid tools and services.
A helpdesk solves a specific problem that free tools can't: it connects your channels so every conversation, regardless of where it started, lives in one place with full context.
What a helpdesk gives you that a shared inbox doesn't:
- A unified inbox that pulls in email, social media DMs, WhatsApp, phone, and contact forms together
- Customer history attached to every ticket, so you can see past orders and past conversations before you reply
- Rules and routing that automatically tag, assign, or respond to certain ticket types
- Shared access for a VA or team member, without the risk of two people replying to the same ticket
Signs it's time to make the move:
- You're spending more than two hours a day on support
- Customers are following up because their original message got missed
- You're considering bringing on help, and you need a system they can work within
Helpdesks with free tiers or trials:
|
Tool |
Free tier |
Best for |
|
Gorgias |
7-day free trial |
Ecommerce brands on Shopify, BigCommerce, or Magento |
|
Freshdesk |
Free up to 2 agents |
General small businesses getting started |
|
Help Scout |
15-day free trial |
Service businesses and small teams |
|
Tidio |
Free tier available |
Brands that want live chat and basic automation |
|
Zoho Desk |
Free up to 3 agents |
Businesses already in the Zoho ecosystem |
When evaluating any of these, prioritize integration with your ecommerce platform, ease of setup, and whether the AI features assist your replies or send automatically without review. For most small businesses just getting started, assisted drafting is the right fit before committing to full automation.
Quick wins you can implement today
These are the changes that take under an hour and make an immediate difference:
- Set an auto-reply on every active channel with your expected response time
- Start a Google Doc with your top 10 most common questions and your best answers to each
- Set up Gmail templates for your five most frequent replies
- Add a FAQ section to your website, even a short one
- If Instagram or TikTok are primary channels for your audience, repurpose your FAQ content as Highlights or pinned posts
- Pick one secondary channel and add a redirect message pointing customers to your primary one
None of these require a paid tool or a technical setup. They just require an hour of focused work and the recognition that a small amount of structure now saves a large amount of time later.
Get the foundation right, and the tools will follow
Good support at small scale comes down to sequence, not software. Consolidate your channels, document your best answers, build templates, and layer in automation only once the basics are working. Each step makes the next one easier.
When free tools stop keeping up, Gorgias connects your channels, integrates with Shopify and BigCommerce, and includes AI features that assist your replies rather than replace your judgment.

How to Prove AI Agent ROI to Leadership
TL;DR:
- AI agent ROI is about business impact, not just ticket deflection, so your report should connect automation to cost savings, team capacity, customer experience, and revenue.
- Executives care about five core metrics: cost savings, automation success rate, customer experience impact, team capacity, and revenue impact.
- Quality matters as much as speed, because faster replies only prove ROI when AI resolves issues accurately and avoids repeat contacts or unnecessary handoffs.
- A strong AI ROI report explains the math, including AI-handled interactions, time saved, cost per human-handled ticket, AI tool costs, and revenue attribution rules.
- AI ROI reporting should become a regular workflow, with daily performance checks, weekly handover reviews, and a monthly business summary for leadership.
Your AI agent is answering tickets, but leadership wants proof that it’s paying off.
That proof can’t stop at ticket deflection or faster replies. To show real AI agent ROI, you need to connect automation performance to cost savings, team capacity, customer experience, and revenue impact.
This guide breaks down the metrics that matter, how to calculate them, and how to turn AI reporting into a business case executives can understand.
Why proving AI agent ROI is harder than it sounds
AI agent ROI is hard to prove because most teams measure activity, not impact.
Ticket deflection doesn’t always mean resolution: A deflected ticket is not always a solved problem. A customer may abandon the conversation, ask the same question later, or contact your team through another channel.
Automation rate needs context: A high automation rate can look impressive in a report. But it needs to be paired with metrics like CSAT, handover rate, repeat contact rate, and resolution time to show whether AI is handling the right tickets well.
Speed can hide quality issues: AI can reduce FRT and resolution time quickly. But fast answers only prove ROI when they’re accurate, helpful, and complete.
Cost savings need a clear calculation: Leadership needs to know how your team calculated savings. That means connecting automated interactions to agent time saved, average handle time, cost per ticket, and AI tool costs.
Revenue impact is easy to miss: AI agents can influence purchases, recommend products, or recover carts. Those results are harder to prove when AI reporting, support data, and ecommerce data live in separate tools.
ROI needs a complete view: No single metric proves AI agent ROI. The strongest reports connect efficiency, customer experience, team capacity, and revenue impact.
The 5 metrics executives actually care about
To prove AI agent ROI, focus on metrics that connect AI performance to business outcomes.
Leadership does not need every AI stat in your dashboard. They need to know whether AI is lowering costs, helping the team scale, protecting customer experience, and contributing to revenue.
1. Cost savings
Executives care about whether AI is reducing the cost of support without creating more work somewhere else.
Track:
- automated interactions
- time saved by agents
- cost per human-handled ticket
- cost per AI-handled interaction
Cost savings show how much money your AI agent saves by handling customer interactions instead of a human agent.
Show how many interactions AI handled, what those interactions would have cost your team, and what it costs for AI to handle them instead.
AI ROI is not just about cutting costs. It’s about helping the business handle more volume without increasing support costs at the same pace.
2. Automation success rate
Is your conversational AI actually giving customers correct, high-quality answers?
Track:
- AI automation rate
- success rate
- handover interactions
- repeat contact rate
Automation success rate shows whether your AI agent is actually resolving customer interactions without human help.
A high automation rate with high escalations may indicate poor AI quality.
A lower automation rate with strong CSAT and fewer repeat contacts may show that AI is handling the right tickets well.
The best AI programs optimize for successful resolution, not maximum automation.
3. Customer experience impact
AI should improve efficiency without hurting the customer experience.
Track:
- customer satisfaction score (CSAT)
- first response time (FRT)
- resolution time
- human response time after AI handoff
- repeat contact rate
Customer experience metrics show whether customers are getting faster, helpful support from AI.
Speed is not the same as quality.
AI can reduce FRT and resolution time, but those gains only matter when customers still get accurate, complete answers.
The strongest AI reports show that customers got help faster and still had a good experience.
4. Team capacity
Executives care about whether AI helps the team scale.
Track:
- time saved by agents
- automated interactions
- closed tickets
- coverage rate
- workload handled by AI
Team capacity shows how much repetitive work AI removes from the queue.
This matters because human agents can spend more time on complex issues, high-value customers, retention risks, and revenue-generating conversations.
Team capacity is not the same as headcount reduction.
A stronger story is that AI helps the same team handle more customer demand without adding the same amount of cost or pressure.
5. Revenue impact
Executives care about whether AI contributes to revenue, not just cost savings.
Track:
- revenue influenced
- orders influenced
- revenue per interaction
- AOV
- purchase rate from AI-assisted conversations
Revenue impact shows whether AI helps shoppers choose products, get answers before purchase, use discounts, or recover carts.
Revenue attribution needs a clear window.
Explain how your team defines an AI-influenced purchase, such as an order placed within a set number of days after an AI-assisted conversation.
AI agents are becoming part of the shopping experience, not just a way to reduce support tickets.
How to build an executive AI ROI report
An executive AI ROI report should show what changed because of your AI agent.
Start with the outcome leadership cares about most, then add the proof underneath.
Step 1: Lead with the headline result
Start with the clearest business impact. That might be cost saved, time saved, revenue influenced, or tickets resolved without human help.
For example: “Our AI agent resolved 8,000 interactions this month and saved the team 420 hours.”
This gives leadership the answer before they have to interpret the data.
Step 2: Show how you calculated it
Explain the math behind the headline result.
If you’re reporting cost savings, show the number of AI-handled interactions, average cost per human-handled ticket, and cost per AI-handled interaction.
This makes the number easier to trust.
Step 3: Add quality checks
Next, prove the AI agent is not just handling volume.
Add success rate, handover interactions, CSAT, and repeat contact rate if available.
This shows whether AI is solving issues well, not just removing tickets from the queue.
Step 4: Connect the result to team capacity
Then show how AI changed the team’s workload.
Use time saved, automated interactions, and queue impact to show whether agents had more time for complex issues, retention risks, or sales-focused conversations.
This turns AI reporting into an operations story.
Step 5: Add revenue impact if AI supports shopping
If your AI agent answers pre-purchase questions, include revenue metrics.
Show revenue influenced, orders influenced, revenue per interaction, and AOV.
Make the attribution window clear, such as purchases made within three days of an AI-assisted conversation.
Step 6: End with what improves next
Close the report with the actions your team will take next.
That might include updating AI instructions, improving handoff rules, filling help center gaps, or reviewing low-CSAT conversations.
This shows leadership that AI performance is being actively managed, not passively monitored.
Common mistakes teams make when reporting AI ROI
AI ROI reporting falls flat when the numbers look impressive but don’t answer the real business question.
Avoid these common mistakes when you’re building your report.
1. Leading with ticket deflection
Ticket deflection is useful, but it doesn’t prove ROI on its own.
A ticket can be deflected without being resolved. Pair deflection with success rate, CSAT, handovers, and repeat contact rate to show whether AI actually solved the issue.
2. Treating automation rate like the goal
A higher automation rate is not always better.
The goal is to automate the right conversations well. If automation rate rises while handovers, repeat contacts, or poor CSAT scores also rise, your AI agent may be creating hidden work.
3. Ignoring the handoff experience
A handoff is not a failure when it gets the customer to the right person faster.
But leadership should know what happens after AI escalates a ticket. Track human response time after AI handoff so you can spot delays, routing gaps, or tickets that need clearer escalation rules.
4. Reporting cost savings without the math
Cost savings need context.
Show how you calculated the number, including AI-handled interactions, average cost per human-handled ticket, agent time saved, and AI tool cost. This makes the ROI story more credible.
5. Leaving revenue out of the report
AI agents can do more than reduce support volume.
If your AI agent helps shoppers choose products, answers pre-purchase questions, recommends SKUs, or offers discounts, include revenue impact. Executives need to see where AI supports both efficiency and sales.
6. Measuring AI in a separate tool
AI reporting gets harder when support data, automation data, CSAT, and revenue live in different systems.
Disconnected reporting makes it harder to prove what changed because of AI. A stronger setup gives your team one place to track AI performance across support, customer experience, and revenue.
How to build AI ROI reporting into your day-to-day workflow
AI ROI reporting works best when it becomes a regular operating habit.
A monthly report can show leadership the results, but your team needs a daily and weekly rhythm to understand what’s improving, what’s breaking, and where AI needs coaching.
- Check performance daily: Review automated interactions, handovers, success rate, CSAT, and any unusual spikes in ticket volume. This helps your team catch issues early, before they show up in an executive report.
- Review handovers weekly: Look at the most common reasons AI escalated tickets to a human agent. Then decide whether the fix is better AI instructions, clearer help center content, more accurate product data, or a new handoff rule.
- Connect AI performance to team workload: Track whether AI is actually giving agents more capacity. Look at time saved, queue volume, AHT, and the types of tickets agents are handling.
- Watch quality, not just automation: Pair automation rate with CSAT, repeat contact rate, handovers, and resolution time. This helps your team avoid chasing a higher automation rate at the expense of customer experience.
- Share a monthly business summary: Turn the daily and weekly signals into a simple leadership update. Show what AI handled, what it saved, how it affected customers, how it affected the team, and what your team is improving next.
See AI agent ROI in one place
Proving AI ROI gets harder when your support, automation, and revenue data live in separate tools.
Gorgias’s AI Agent brings AI-specific reporting into the same helpdesk your team uses every day, so you can track what AI handled, what it saved, and how it contributed to the customer experience.
Book a demo to see how AI Agent helps ecommerce teams measure and improve AI support from one customer experience platform.
{{lead-magnet-1}}
Ticket Volume: How to Measure It, Benchmark It, and Reduce It
TL;DR:
- Ticket volume is your support workload: It counts every customer inquiry across every channel in a given time period.
- High volume signals friction in your business: Spikes usually point to unclear policies, product issues, or gaps in your website experience.
- Every ticket has a real cost: Agent time, tooling, and overhead add up fast — and they compound during peak seasons.
- Automation reduces volume without reducing quality: AI tools and self-service deflect repetitive questions while keeping customers satisfied.
- Measurement drives improvement: Tracking volume by channel, category, and time period reveals exactly where to focus your efforts.
Your ticket volume number is probably wrong. If customers are reaching you through email forwards, Slack DMs, or channels that bypass your helpdesk, those tickets aren't being counted, and your SLA reporting is built on incomplete data. This guide covers how to get an accurate count, break it down by channel and category, and use your vertical benchmark to figure out whether your volume is actually a problem or just normal for your industry.
What is ticket volume?
Ticket volume is the total number of customer inquiries your support team receives across all channels — email, live chat, phone, social media, and contact forms — within a specific time period. It is the most direct measure of your team's workload.
Do not confuse it with contact rate. Contact rate = tickets ÷ orders (or customers). That normalized number is more useful for benchmarking and planning because it accounts for business growth. Raw ticket volume tells you how busy your team is. Contact rate tells you whether support demand is outpacing your business.
How to calculate your ticket volume
Start by looking at the last 30 days of customer conversations, no matter where they currently live.
Pull these four numbers:
- Total customer questions received across all channels
- Breakdown by channel (email, chat, social DMs, phone, contact forms, etc.)
- Breakdown by category (shipping, returns, product questions, account issues)
- Tickets or conversations per order during the same period — this gives you your contact rate baseline
Here’s how to pull that data depending on your setup:
Gmail or Outlook
Open your inbox or Sent folder and filter by the last 30 days. Count how many customer conversations came in during that period. You can also copy subject lines into ChatGPT or Claude to group conversations by topic.
Shopify Inbox
Go to Inbox > Conversations and review your recent conversations. Count how many messages you received and look for repeated themes or questions.
Any helpdesk (Gorgias, Zendesk, Freshdesk, Help Scout, etc.)
Most helpdesks have ticket reporting or exports built in. Search “export tickets” or “ticket report” in your platform’s help center. From there, you can pull:
- Total tickets
- Channel breakdown
- Top ticket categories
- Tickets over time
If a large portion of customer questions are still happening in untracked places like Slack DMs, personal inboxes, or Instagram comments, your reporting is incomplete. Before optimizing support operations, route customer conversations into one shared system so you can accurately measure volume, response times, and recurring issues.
Why your volume breakdown matters more than the total
A raw ticket count tells you how busy your team is. The breakdown tells you what to fix.
|
Category |
What high volume signals |
What to do |
|
"Where is my order?" |
No proactive shipping updates; poor tracking page |
Automate WISMO with AI Agent; add tracking link to order confirmation |
|
Returns and exchanges |
Confusing return policy; no self-serve portal |
Add a clear returns page; enable self-serve exchange flows |
|
Sizing and product questions |
Weak product page content |
Add size guides, FAQs, and fit notes directly on product pages |
|
Account and subscription issues |
Customers can't self-serve basic account changes |
Build or improve your Help Center; enable self-serve account management |
|
Payment and billing |
Checkout friction or unclear pricing |
Fix at the source — this is rarely a support problem |
Run this categorization for your last 30 days. Your top two or three categories are your highest-leverage targets.
Track volume alongside these KPIs
Ticket volume only tells part of the story. Track it alongside:
- Contact rate (tickets ÷ orders) — so you know if volume is growing faster than your business
- First response time (FRT) — volume spikes show up here first
- Average handle time (AHT) — high AHT + high volume = a capacity problem
- Cost per ticket — total support costs ÷ total tickets, the clearest financial measure
- Backlog size — a growing backlog is the earliest warning sign that volume is outpacing capacity
- Deflection rate — tickets resolved through self-service or automation without agent involvement
How to reduce ticket volume without reducing quality
Once you know what is driving your volume, address each category at the source. The goal is to eliminate unnecessary tickets.
Automate the highest-volume, lowest-complexity tickets first. WISMO inquiries, order status checks, and basic return initiations require no agent judgment. An AI Agent connected to your ecommerce platform can handle these end-to-end without a human stepping in. When a question is too complex, the AI escalates it with full context attached.
Build self-service content around your top categories. A Help Center that directly addresses your most common ticket types is the highest-leverage tool for sustained volume reduction. Start with your top five categories. Write one article per category. Surface those articles on relevant product pages, in checkout, and in post-purchase emails — before customers need to search.
Send proactive messages at the moments that generate the most tickets. Post-purchase is the single highest-value touchpoint: an order confirmation that includes a tracking link, estimated delivery window, and a clear link to your return policy eliminates a large share of inbound questions before they are ever submitted.
Measure deflection, not just volume. Deflection rate, the percentage of issues resolved through self-service or automation, is the metric that tells you whether your volume reduction efforts are actually working. Track it weekly alongside CSAT for automated interactions to make sure quality is holding.
Ticket volume benchmarks
The all-industry average is not your benchmark. Ticket volume per 100 orders varies 2.4x across verticals, so comparing yourself to a cross-industry number will either make you complacent or create false urgency.
According to Gorgias platform data from March 2026 across 14 verticals at the $10M GMV band, here is what tickets per 100 orders actually looks like by vertical:
|
Vertical |
Tickets per 100 orders |
|
Electronics |
46 |
|
Vehicles & Parts |
46 |
|
Hardware |
41 |
|
Luggage & Bags |
32 |
|
Home & Garden |
32 |
|
Sporting Goods |
32 |
|
Baby & Toddler |
24 |
|
Business & Industrial |
25 |
|
Animals & Pet Supplies |
25 |
|
Apparel & Accessories |
22 |
|
Health & Beauty |
21 |
|
Arts & Entertainment |
21 |
|
Food & Beverages |
20 |
|
Toys & Games |
19 |
Source: Gorgias Ecom Lab, March 2026
High ticket volume is not always a sign of poor CX — it often reflects product complexity. Electronics brands generate nearly one ticket per two orders because customers have more pre- and post-purchase questions about technical products. Food and Beverage brands generate about one in five. That gap is not a performance difference; it is a category difference.
The right question is not "are we below 10 tickets per 100 orders?" It is "are we above or below our vertical peers?" Find your row. That is your baseline. Then use the reduction tactics above to move below it.
How to predict ticket volume if your tool charges per ticket
If your ticketing tool uses usage-based pricing, where your bill scales with ticket volume rather than agent headcount, forecasting volume directly affects your budget.
The core formula is simple:
Projected tickets = projected orders × (tickets per 100 orders ÷ 100)
So if you expect 2,000 orders next month and your vertical median is 22 tickets per 100 orders, your forecast is approximately 440 tickets.
But a flat monthly estimate misses the real risk: peak seasons. A volume spike during BFCM that triples your order volume will also triple your ticket count — and your bill — unless you have guardrails in place.
To build a more accurate forecast:
- Use your contact rate, not raw volume. Divide your tickets by orders for each of the last 12 months. This gives you a stable ratio that accounts for business growth and seasonal swings.
- Apply that ratio to your order forecast. If your marketing team has a sales projection for November, multiply it by your contact rate to estimate support volume.
- Separate your AI-handled tickets from agent-handled tickets. Some platforms bill differently for automated resolutions versus human ones. If you're using an AI Agent to deflect WISMO and returns, those deflected tickets may not count toward your billable volume at all — which changes the math significantly.
- Build in a buffer for peak periods. Your contact rate tends to rise during high-demand periods, not just your order volume. First-time customers generate more tickets than repeat buyers, and BFCM brings a disproportionate share of first-timers.
Before signing any usage-based contract, ask two questions: What counts as a billable ticket? And is there a hard cap on monthly charges? Variable billing only works in your favor if you have clear definitions of what triggers a charge and a ceiling on how high costs can go during an unexpected spike.
If your platform bills per ticket resolved by a human agent (not AI), your deflection rate becomes a financial metric, not just an operational one. Every percentage point of additional deflection directly reduces your bill.
Start reducing ticket volume today
Begin by identifying your top ticket categories, then work backward to find the root cause of each one.
From there, layer in self-service content, automation, and proactive messaging to address those root causes directly. The result is a support operation that handles more customers and a team that spends its time on the work that actually requires human judgment.
Book a demo to see how Gorgias helps ecommerce brands reduce ticket volume and improve customer experience at the same time.
{{lead-magnet-2}}

Customer Service Benchmarks: Real Data from 1,000+ Ecommerce Brands
TL;DR
- Eight metrics define support performance: CSAT, NPS, CES, FCR, FRT, AHT, TTR, and SLA adherence are the core benchmarks to track.
- First response time varies 5.5x across ecommerce verticals — your vertical benchmark matters more than any industry average.
- Benchmarking is a six-step process: Define goals, select metrics, source benchmarks, capture data, analyze gaps, and set targets.
- Benchmarks connect support to revenue: Faster response times and higher resolution rates directly affect repeat purchases and customer retention.
- Brands at 30%+ automation respond 10x faster than brands at zero — with the same or better CSAT.
The benchmarks in this article are drawn from the Gorgias Ecom Lab, a research hub that publishes platform-level behavioral data from thousands of ecommerce brands. Where we cite a specific figure, it comes from that data, not generic industry surveys.
What is customer service benchmarking?
Customer service benchmarking is the practice of comparing your support performance to industry standards or peer data to find gaps and set improvement targets.
It means measuring how your team performs on metrics like response time and satisfaction scores — then checking those numbers against what similar businesses achieve. The goal is not just to measure. It's to create a clear picture of where you stand and what to fix first.
Benchmarking has four core components:
- Baseline measurement: Recording your current performance across all support channels before making any changes.
- Peer comparison: Looking at how brands of similar size and type perform on the same metrics.
- Gap analysis: Pinpointing where your numbers fall short of industry targets.
- Target setting: Using benchmark data to define realistic, time-bound goals for your team.
Why customer service benchmarks matter for ecommerce brands
Benchmarks turn "we need to improve support" into a specific, actionable goal. Instead of a vague directive, you get a clear target: reduce email response time from 48 hours to 24, or lift CSAT from 72 to 82 percent.
Here's what most benchmarking guides won't tell you: the all-industry average is often the least useful number in the room.
Ecom Lab data across 14 ecommerce verticals shows that first response time varies 5.5x at the same $10M GMV band — from 1.6 hours in Hardware to 8.8 hours in Apparel. A brand sitting in the middle of that range looks fast against one peer and slow against another. Without vertical context, the comparison tells you nothing.
For ecommerce brands, support performance also connects directly to revenue. Customers who get fast, accurate answers are more likely to complete a purchase and come back again. That shows up across the whole business — from support team efficiency to operations, finance, and marketing.
Core customer service benchmarks to track
These eight metrics are the foundation of support performance measurement. Each one captures a different dimension of the customer experience, from speed to ease to loyalty.
First response time
First response time (FRT) is the time between a customer sending a message and receiving your team's first reply.
This is the metric customers feel most immediately — and the one with the most variation across ecommerce brands. According to the Ecom Lab report Stop Benchmarking Against the Average, FRT varies 5.5x across 14 ecommerce verticals at the same revenue band. CSAT, by contrast, varies by just 0.2 points across those same verticals. If you want to know whether your operation is ahead of your peers, FRT is the metric that will tell you.
General targets by channel:
- Email: Under 24 hours (excellent: under 12 hours)
- Live chat: Under one minute (excellent: under 30 seconds)
- Social media: Under two hours (excellent: under one hour)
- Phone: Under three minutes hold time
AI automation changes what's achievable here. Brands automating close to zero percent of tickets average 736-minute response times. At 30% automation, that drops to 80 minutes. At 40%, 12 minutes.
The gains don't scale evenly — they accelerate. If your team has deployed any AI, your FRT benchmark should reflect your automation rate, not just your channel.
First contact resolution
First contact resolution (FCR) measures the percentage of tickets resolved in a single interaction, without the customer needing to follow up.
A high FCR means your team has the right information and authority to solve problems on the first attempt. The industry target is 70 to 75 percent across all channels.
For teams running AI, there's a more actionable metric to track alongside FCR: AI Resolution Rate — the share of AI-touched tickets that close end-to-end without any human involvement.
Ecom Lab data shows the median ecommerce brand resolves 45% of AI-touched tickets end-to-end. The top quartile reaches 65%. Every point of improvement removes a 10-hour median wait and a one-in-three abandonment risk from a customer's experience.
Read more: First contact resolution rate: Your guide to understanding the metric
Customer satisfaction score
Customer satisfaction score (CSAT) measures how satisfied a customer was with a specific support interaction, typically through a short post-conversation survey.
The standard benchmark is 80 to 85 percent. Ecommerce brands with proactive, personalized support often reach 85 to 90 percent. For a deeper look at moving that number, see How to Improve CSAT: 8 Fixes That Make a Real Difference.
Two things stand out from Ecom Lab data. First, CSAT is remarkably stable across verticals — it varies by only 0.2 points at the same revenue band, so your category matters far less here than it does for FRT.
Second, there is a modest tradeoff early in AI adoption: brands at 20% automation average 87.9% CSAT, versus 90.3% at zero. This reflects AI encountering more diverse ticket types as coverage expands. Brands that move past 30% automation and properly configure their AI bring CSAT back up while keeping response times fast.
Net promoter score
Net promoter score (NPS) asks customers how likely they are to recommend your brand to someone else, scored on a scale of zero to 10.
It reflects the overall customer experience — not just a single interaction. The ecommerce benchmark is between 30 and 50, with anything above 50 considered strong. See How To Calculate Net Promoter Score for the full methodology.
Customer effort score
Customer effort score (CES) measures how easy it was for a customer to get their issue resolved, typically on a seven-point scale.
Lower effort correlates with higher repeat purchase rates. The industry benchmark is 5.5 or higher.
The single biggest driver of high-effort experiences is the handoff wait. According to the Ecom Lab report The Cheapest Ticket Is the One a Human Never Touches, the median wait between an AI handing off and a human responding is 10 hours. At the 90th percentile, that wait hits 71 hours — three full days. And a third of handed-off tickets never receive a human response at all.
That experience is what drives CES scores down. Reducing handoffs, not just handling them faster, is the most direct path to a better effort score.
Average handle time
Average handle time (AHT) is the total time an agent spends on a live interaction, including hold time and wrap-up work.
It measures efficiency without accounting for quality, so it works best alongside CSAT and FCR.
Targets by channel:
- Phone: 6 to 8 minutes
- Live chat: 5 to 7 minutes
As automation rate rises, AHT on human-handled tickets typically drops — AI absorbs the simple volume and leaves agents with a shorter, more focused queue. Ecom Lab data shows that at 50%+ automation, AI does the equivalent work of 6.3 full-time agents while the human team at that tier averages just 3 people. Those agents handle 29% more tickets per month and spend more time on the complex issues that actually require judgment.
Time to resolution
Time to resolution (TTR) is the total time from when a ticket opens to when it fully closes.
Unlike FRT, which measures only the first reply, TTR captures the entire support interaction. For a closer look at this metric and how to reduce it, see Resolution Time: What It Is and How to Reduce It.
General targets by complexity:
- Simple inquiries: Under 24 hours
- Complex issues: 24 to 72 hours
- Technical problems: 3 to 5 business days
For brands with AI in the mix, Ecom Lab data gives channel-level baselines for tickets that require human involvement. Contact form handoffs resolve in a median of 36 hours with a 42% abandonment rate. Email handoffs resolve in 32 hours and abandon 30% of the time. Chat resolves in 8 hours and abandons 13%, because real-time pressure forces faster responses.
These aren't just benchmarks to optimize — they're the cost of every ticket that doesn't resolve end-to-end.
Service level agreement adherence
A service level agreement (SLA) is a defined commitment to respond to or resolve tickets within a set timeframe.
SLA adherence measures the percentage of tickets where your team meets that commitment. The industry benchmark is 90 to 95 percent compliance. For the tactics that make hitting those commitments repeatable, see SLA Best Practices for Effective Support Ticket Management.
How to benchmark customer service performance
Benchmarking works best as a structured process, not a one-time audit. These six steps take you from identifying what to measure to building a plan for improvement.
Step 1: Define your goals
Start by deciding what you want to improve and why.
Are customers complaining about slow responses? Are agents spending too long on simple tickets? Tying your benchmarking effort to a specific business problem keeps the process focused and the results actionable. Limit your initial scope to three to five metrics — tracking everything at once makes it harder to act on what you find.
Step 2: Choose the right metrics
Pick metrics that match the problem you identified in step one.
If customers are frustrated by how long it takes to get help, FRT and TTR are your starting points. If satisfaction scores are slipping, CSAT and CES will tell you more. Match the metric to the pain point.
If you have any automation running, add AI Resolution Rate to your list. The median brand sits at 45%; the top quartile is at 65%. A gap between your rate and the top quartile almost always comes down to one of four things: limited intent coverage, insufficient action authority (AI can't issue refunds or apply discounts), missing system integrations, or an escalation policy that's routing too much to humans by default.
Step 3: Source your benchmarks
You need external data to compare against. Reliable sources include:
- Industry reports: Published by customer service associations and research firms.
- Helpdesk platforms: Many publish benchmark data from their customer base, including Ecom Lab.
- Peer networks: Non-competing brands in adjacent markets often share performance data.
- Customer surveys: Direct feedback on what customers expect from your support.
One critical caveat: filter by your specific vertical, not just "ecommerce." Ticket volume per 100 orders varies nearly as much as response time. Electronics brands generate about 46 support tickets per 100 orders. Food & Beverages brands generate about 20. If you're in a high-ticket-volume vertical, that's your baseline — not a problem to fix.
Step 4: Measure your current performance
Pull at least three months of data from your helpdesk to establish a reliable baseline.
Shorter windows get skewed by seasonal spikes or one-off events. Make sure you're measuring each metric the same way across all channels so the data is consistent. How to Evaluate the Effectiveness & Impact of Your Customer Service Team is a good companion resource for this step.
Step 5: Identify and diagnose gaps
Compare your numbers to the benchmarks you sourced.
Look for patterns. Are certain channels consistently slower? Do specific ticket types take longer to resolve? The goal is to understand why the gap exists, not just that it does.
Step 6: Set targets and build an action plan
Use your gap analysis to set incremental targets.
If your email FRT is 48 hours and the benchmark is 24, aim for 36 hours first. Assign ownership, set a timeline, and schedule a review date. Benchmarking only drives improvement when it leads to a concrete next step.
What good benchmarking looks like in practice
Benchmarking changes how your team operates day to day. Agents know what "good" looks like and can measure their own progress against it. Managers can identify coaching opportunities using real data rather than observation alone.
For ecommerce brands specifically, the operational benefits compound over time:
- Lower cost per ticket: Efficient workflows reduce the time and resources needed to resolve each issue.
- Higher repeat purchase rates: Customers who get fast, easy support are more likely to buy again.
- Reduced cart abandonment: Quick answers to pre-purchase questions keep shoppers moving toward checkout. See Reduce Cart Abandonment: Proven, Data-Backed Strategies.
- Stronger team accountability: Clear targets give agents and managers a shared definition of success.
The financial picture from the Ecom Lab report Most Brands Are Overpaying for Support is concrete. Even at the lowest automation tier, brands net $73K per year after platform costs.
Nearly 1 in 4 brands (23.5%) reduced their support team after enabling Gorgias AI Agent. Of those, 51% achieved all three outcomes at once: fewer people, same ticket volume, same or more revenue. Brands that reduced by at least one person saw each remaining agent handle 29% more tickets per month while revenue grew 22%.
The adoption gap matters too. Only about 1 in 5 ecommerce brands has deployed AI in customer-facing support today. Brands at near-zero automation average 736-minute response times. Brands at 30%+ automation average 80 minutes.
That's not an incremental improvement. It's a structural shift.
Improve your benchmarks with Gorgias
Benchmarks tell you where to focus. The right tools help you get there.
Gorgias gives ecommerce support teams a unified view of every customer conversation, with built-in reporting that tracks the metrics that matter most. AI Agent resolves routine tickets automatically — across email, chat, and SMS — so your team spends less time on repetitive requests and more time on work that requires a human touch.
Book a demo to see how Gorgias helps ecommerce brands hit and exceed their customer service benchmarks.
{{lead-magnet-2}}

Gorgias AI Agent Guardrails: What They Are and How to Configure Them
TL;DR:
- AI Agent only answers from sources you connect. Help Center articles, your website, uploaded documents, and Shopify data. Nothing outside of that.
- Every behavior is configurable. What AI Agent says, how it sounds, which topics it handles, and which ones it always passes to a human are all settings you control in plain language.
- You decide what AI Agent never touches. Handover topics and exclusions let you route specific ticket types directly to your human team, every time, regardless of what AI Agent knows.
- Configuration is ongoing, not a one-time setup. A monthly review of flagged tickets and Guidance Opportunities keeps AI Agent calibrated as your policies and products change.
How much of AI Agent can you actually control? The answer is more than most people expect.
AI Agent has several distinct control layers — what it knows, how it speaks, which topics it handles, which ones it passes to your team, and what actions it can take on a customer's behalf. Each layer is configurable in plain language, directly inside your Gorgias settings.
This article walks through each control, what it does, and what good configuration looks like in practice.
{{lead-magnet-1}}
How to tell AI Agent how to behave
AI Agent allows you to configure four inputs: Guidance, tone of voice and language, handover topics and exclusions, and knowledge sources.
Each one controls a different dimension of AI Agent's behavior. Together, they determine what AI Agent knows, how it communicates, what it will and won't handle, and where it draws its answers from.
Guidance: your policies and instructions, in plain language
Guidance is the highest-priority input in AI Agent's knowledge hierarchy. When information exists in both a Guidance and another source — like a Help Center article or a connected URL — AI Agent always follows the Guidance first.
It's designed for rules and behavioral instructions, not just answers. Good examples of what belongs in a Guidance:
- "Do not offer a discount without a human agent approving it first."
- "If a customer mentions a legal dispute or uses the word 'lawyer,' hand over immediately."
- "Always confirm the order number and email address before processing a return."
- "Do not provide medical advice or interpret how our products may affect specific health conditions."
You can add up to 100 Guidance, and each one can be as specific as your policies require.
Be specific. Vague instructions produce vague behavior. "Handle returns politely" leaves AI Agent to interpret what that means. A more useful Guidance looks like this:
"For return requests: confirm the order number, check whether the item is within the 30-day return window, and if eligible, send the prepaid return label link. If outside the window, explain the policy and hand over to a human agent."
Nothing left to chance. When writing Guidance, focus on the situation and the desired outcome.
Keep it current with Guidance Opportunities. Over time, AI Agent detects recurring questions it could not confidently answer and surfaces them as suggested new Guidance in your dashboard. Review, edit to match your policies, then approve or dismiss. Nothing is added without your sign-off.
Read more: How to write Guidance with the “when, if, then” framework
Tone of voice: how AI Agent sounds
Tone of voice is a separate setting from Guidance and knowledge. It controls how AI Agent communicates, the register, the warmth, the vocabulary, rather than what it says or what it does.
You have four options:
- Friendly. Warm, approachable, and casual. Empathetic and encouraging.
- Professional. Formal, respectful, and focused. Business-like without being cold.
- Sophisticated. Refined and considered. Complex vocabulary, subtle nuance.
- Custom. Your instructions, in plain language, up to 5,000 characters.
Custom is where brands with specific voice guidelines should spend time. Describe your communication style the same way you'd brief a copywriter: words and phrases that fit your brand, what to avoid, how to handle emotionally charged conversations. Emoji usage and phrases your team always or never uses can all go here.
Two things to keep separate as you configure this:
- Tone vs. Guidance: Tone of voice tells AI Agent how to write. Instructions about specific situations, like "when a customer asks about returns, do X," belong in Guidance, not here. Mixing the two produces inconsistent results.
- Tone vs. Language: AI Agent supports over 80 languages and automatically replies in the language a customer writes in. Language is its own dedicated setting. If you've been using the tone of voice field to control language, switch, as it can conflict with how responses are generated.
Tone usually takes a few iterations to get right. Use the test conversation feature, found under AI Agent > Test, to simulate customer conversations and verify how AI Agent sounds before it goes live.
Learn more: Customize AI Agent's tone of voice
Handover topics and exclusions: what AI Agent should never touch
Handover topics and exclusions give you explicit control over which conversations AI Agent handles and which go straight to your human team. Both live in the Handover and Exclusion section of your AI Agent settings.
Handover topics are subjects AI Agent is always instructed to pass to a human, even if it has relevant information. You add them in plain language. Some examples worth considering for most stores:
- Legal disputes or any mention of legal action
- Medical questions or references to health conditions
- Fraud-related language or chargeback mentions
- Any request that requires a judgment call outside of written policy
Exclusions work differently. Using the "Prevent AI Agent from answering" Rule, you can tell AI Agent to ignore certain tickets entirely, based on a tag, a sender's email address, or specific words in the message. These tickets stay in the queue for your human agents without AI Agent touching them.
You can also toggle whether AI Agent tells the customer it is handing them over, or does so silently. Both options are available in the same section.
Note that AI Agent hands over automatically in some situations regardless of configuration, including when it cannot find a relevant answer, when a response does not pass its internal quality check, and when a customer asks to speak to a human.
Read more: Customize how AI Agent hands over to your team
Knowledge sources: what AI Agent draws from
AI Agent's answers are grounded entirely in the sources you connect. It won't speculate beyond them, and if it cannot find a relevant answer, it hands over instead of guessing.
The sources you can connect are:
- Help Center articles. Your existing documentation and policy pages.
- Your store website. Crawled automatically when you connect it.
- Specific public URLs. Individual pages you want AI Agent to reference.
- Uploaded documents. PDFs, Word docs, or spreadsheets with product or policy information.
- Shopify data. Order history, customer profiles, product catalog, and fulfilment information.
Start by connecting what you already have. Gaps will surface quickly through handovers in the inbox or through Guidance Opportunities flagging unanswered questions. Adding a URL or uploading a document is usually faster than writing a Guidance for every scenario.
Learn more: Onboard AI Agent with knowledge sources
Which channels should AI Agent be active on?
AI Agent runs on email, chat, and SMS. None are on by default. You enable each one manually. Turning a channel off doesn’t affect your configuration.
Email is where most brands start. AI Agent handles incoming tickets, filters spam, and pulls from your knowledge sources and Shopify data to reply with context. Anything it cannot resolve gets handed over with the full conversation attached.
Chat is faster and more transactional. Customers tend to ask shorter, more immediate questions — order status, return eligibility, quick policy checks. AI Agent adapts automatically, writing shorter and more conversational replies on chat than it would on email.
SMS requires a separate add-on subscription. It is the most tone-sensitive channel, so configure your tone of voice carefully and test thoroughly before enabling AI Agent here.
There is no required order for activation. Most brands pick the channel with the highest ticket volume and clearest policies, then expand. Switching a channel off is a simple toggle. Nothing gets deleted.
How to test AI Agent before it goes live
Before enabling AI Agent on any channel, test it first. Gorgias has a built-in test conversation feature that lets you simulate customer interactions without affecting real tickets, reporting, or customers. Go to AI Agent > Test.
Step 1: Start with your hardest tickets. Skip the generic questions. Test the scenarios that made you hesitant in the first place — complex product questions, return edge cases, sensitive topics on your handover list. If AI Agent handles these well, you can activate with confidence.
Step 2: Test each channel separately. AI Agent adapts its response style by channel. Shorter on chat, more detailed on email. A response that reads well on email may feel too long on chat, so configure the channel in the test settings to match the one you are evaluating.
Step 3: Check your handovers. Send a message containing the language or scenario you want escalated. Confirm AI Agent passes it to your team rather than attempting a response. Do this for every topic on your handover and exclusion list.
Step 4: Test your tone. Run several conversations before settling on your tone configuration. Try emotionally charged messages, not just neutral ones. Tone usually takes a few rounds to get right.
Test conversations do not count toward your automated interaction billing.
What should AI Agent escalate to a human?
Some tickets should never be handled by AI. Not because AI Agent cannot generate a response, but because the situation calls for a human regardless.
There are two types of escalation to understand: the ones AI Agent does automatically, and the ones you configure yourself.
Automatic escalations. These are built in and can’t be turned off. AI Agent hands over automatically when it lacks confidence in an answer, when it can’t find relevant content in its knowledge sources, when it detects customer anger or frustration, and when a customer explicitly asks to speak to a human.
Every response also passes through an internal QA step — a second AI model measures confidence, and if the response does not meet the threshold, it is not sent.
Configured escalations. These are yours to define. Two tools handle this.
Handover topics tell AI Agent to always pass a conversation to a human on a specific subject, even if it has relevant information. Add them in plain language in your AI Agent settings. Good candidates for most stores:
- Legal disputes or any mention of legal action
- Medical questions or references to health conditions
- Fraud-related language or chargeback mentions
- Any complaint requiring a judgment call outside of written policy
Exclusions go further. Using the "Prevent AI Agent from answering" Rule, you can tell AI Agent to ignore certain tickets entirely, based on tags, sender email addresses, or specific words in the message. These tickets never get touched by AI Agent at all.
Route escalations to the right place. When AI Agent hands over, configure which tag, team, or queue the ticket routes to. A return escalation goes to fulfilment. A billing dispute goes to a senior agent. Escalated tickets should never land in a generic inbox.
Learn more: Security and privacy FAQ for Gorgias AI Agent
How to review what AI Agent did and improve it over time
Configuration is not a one-time task. The brands who get the most out of AI Agent check in regularly, flag what is not working, and update its knowledge as policies and products change. Here is a simple review checklist to run through on a monthly basis, or after any major policy or product update.
- Read flagged tickets. Open your inbox and filter for AI Agent conversations labeled "Automated." Check the full thread and which knowledge sources were used. If a response looks off, the source is visible.
- Rate what you see. Mark tickets as good, ok, or bad. For negative ratings, select a reason — wrong answer, wrong tone, should have escalated. This feeds directly into Guidance Opportunities.
- Check the Intents page. Go to AI Agent > Intents to see which topics AI Agent is handling and where handovers are clustering. Recurring handovers on the same topic mean a Guidance is missing.
- Review Guidance Opportunities. Open your dashboard and work through pending suggestions. Edit each one to match your policies, then approve or dismiss. Nothing is added without your sign-off.
- Update your Guidance. Any time a policy changes, a new product launches, or a seasonal shift affects your return or shipping terms, review relevant Guidance and update accordingly.
Learn more: Continuously improve AI Agent with Opportunities (Beta)
Considerations for sensitive and regulated categories: what to configure differently
Most of the configuration covered in this article applies to every store. This section is for brands in categories where the stakes of an incorrect or out-of-scope response are higher. Skim to your vertical and take what applies.
Health and wellness
- Block medical advice. Write a Guidance that explicitly instructs AI Agent not to interpret how products may affect specific health conditions, and to hand over if a customer asks.
- Add a second layer. Add medical questions as a handover topic in addition to your Guidance.
- Upload usage documentation. For products with complex instructions, upload those documents as a knowledge source so AI Agent answers accurately without improvising.
Food and beverage
- Keep allergen content current. Make sure Help Center articles on ingredients and allergens are accurate, up to date, and connected as a knowledge source.
- Set clear boundaries in Guidance. Specify exactly what AI Agent can and cannot say about allergens and ingredients.
- Use exclusions for ambiguous formulations. Where product ingredients change frequently, exclusions are safer than handovers. AI Agent will not touch those tickets at all.
Subscriptions
- Gate sensitive actions with conditions. Only allow cancellations or pauses after a minimum subscription duration.
- Require customer confirmation. Enable confirmation for any action that modifies a subscription before it executes.
- Add billing topics to your handover list. Billing disputes and chargeback mentions should always go to a human.
Now, let's set it up for your store
You now know exactly what you can control, and there is more of it than most brands expect. The next step is seeing it configured for your store specifically.
{{lead-magnet-2}}
15 Best Intercom Alternatives for Ecommerce Brands in 2026
TL;DR:
- Intercom's pricing structure jumps sharply between tiers, making it expensive for growing ecommerce brands
- Gorgias is built for Shopify with native order management, AI automation, and proactive sales tools in one platform
- Budget-friendly options like Crisp and Tidio offer free tiers for brands just getting started
- Enterprise platforms like Zendesk and Salesforce Service Cloud offer scale but require significant setup and investment
- The right choice depends on your platform, ticket volume, and whether you need support, sales, or both
Intercom built its reputation as a customer messaging tool for SaaS companies. As it shifted toward enterprise, many ecommerce brands found themselves paying more for features they didn't need — and missing the ones they did. This guide covers the 15 best Intercom alternatives, evaluated specifically for ecommerce brands on Shopify and beyond.
Why brands switch from Intercom
Intercom is a customer messaging platform that combines live chat, email, and automation for support and sales. It works well for SaaS companies, but ecommerce brands often run into friction fast.
The biggest issue is pricing. The jump from the Essential plan ($74 USD per month) to the Advanced plan ($395 per month) is steep, and many features — like custom bots and product tours — cost extra on top of that. For a growing brand managing hundreds of tickets a week, the total cost adds up quickly.
Beyond price, Intercom was not built with ecommerce in mind. There is no native Shopify integration, no order management inside conversations, and limited automation for common requests like "Where is my order?" That gap pushes many brands to look for tools designed around how online retail actually works.
Best Intercom alternatives at a glance
Platform |
Starting price |
Free plan |
Best for |
Gorgias |
$10 USD/month |
Limited |
Shopify brands |
Zendesk |
$55/agent/month |
No |
Enterprise support |
Freshdesk |
$15/agent/month |
Yes |
Budget-conscious teams |
Help Scout |
$25/user/month |
No |
Email-first support |
Kustomer |
$89/user/month |
No |
CRM-focused brands |
Drift |
Custom |
No |
B2B sales teams |
Tidio |
$29/month |
Yes |
Small businesses |
Crisp |
$25/month |
Yes |
Startups |
Zoho Desk |
$14/agent/month |
No |
Zoho ecosystem users |
Front |
$19/seat/month |
No |
Collaborative inboxes |
Gladly |
$150/agent/month |
No |
Premium brands |
LiveAgent |
$9/agent/month |
No |
All-in-one on a budget |
HubSpot Service Hub |
$20/month |
No |
HubSpot users |
Salesforce Service Cloud |
$25/user/month |
No |
Large enterprises |
Groove |
$16/user/month |
No |
Small teams |
The 15 best Intercom alternatives for 2026
1. Gorgias
Gorgias is a customer experience (CX) platform built specifically for ecommerce brands. It connects your helpdesk directly to Shopify, so agents can view orders, issue refunds, and update subscriptions without leaving the conversation.
The AI Agent handles up to 60% of incoming tickets automatically — shipping questions, return requests, order status — across email, chat, and SMS. The Shopping Assistant goes further, proactively engaging shoppers on product pages to help them find the right item and complete their purchase.
Gorgias is the strongest Intercom alternative for Shopify brands that want support and sales in one place.
Key features:
- Native Shopify integration with real-time order data
- AI Agent that resolves tickets autonomously
- Shopping Assistant for proactive product recommendations
- 100+ ecommerce app integrations
- Unified inbox for email, chat, SMS, voice, and social
Pricing:
- Starter: $10/month (50 tickets)
- Basic: $60/month (300 tickets)
- Pro: $360/month (2,000 tickets)
- Advanced: $900/month (5,000 tickets)
{{lead-magnet-1}}
2. Zendesk
Zendesk is an enterprise helpdesk platform that handles high ticket volumes across email, chat, voice, and social. Its reporting tools are among the most advanced available, and its marketplace includes hundreds of integrations.
It is a strong fit for large teams with complex workflows. For smaller ecommerce brands, the setup time and per-agent pricing can be a barrier.
Pricing: Suite Team starts at $55/agent/month
3. Freshdesk
Freshdesk is a helpdesk platform with a free tier for up to 10 agents, making it one of the most accessible Intercom alternatives for teams on a tight budget. It includes ticketing, automation, and a knowledge base across its plans.
Its ecommerce integrations are less deep than purpose-built tools, but it covers the basics well for brands managing moderate ticket volume.
Pricing: Free for up to 10 agents; paid plans from $15/agent/month
4. Help Scout
Help Scout is a shared inbox tool that makes email support feel personal and organized. Agents work in a clean interface that looks like a regular email client, which reduces the learning curve significantly.
When comparing Help Scout vs Intercom, Help Scout wins on simplicity. It suits brands that rely heavily on email and want a tool their team can use on day one.
Pricing: Standard plan starts at $25/user/month
5. Kustomer
Kustomer is a CRM-first platform that organizes every customer interaction into a single timeline. Agents see the full history of a shopper's orders, conversations, and behavior in one view.
It is best suited for enterprise brands that need deep personalization and are willing to invest in a more complex setup. Pricing reflects that positioning.
Pricing: Enterprise plan starts at $89/user/month
6. Drift
Drift is a conversational marketing platform built for B2B sales teams. Its chatbots qualify leads, book meetings, and route prospects to sales reps automatically.
When comparing Drift vs Intercom, both target sales use cases — but neither is built for ecommerce. Drift's pricing starts at $2,500/month, making it one of the most expensive options on this list.
Pricing: Premium starts at $2,500/month; advanced plans are custom
7. Tidio
Tidio is a live chat and chatbot tool aimed at small ecommerce businesses. Its free plan covers up to 50 conversations per month, and its paid plans are affordable for brands just scaling up.
The chatbot builder is easy to use without technical knowledge. It lacks the deep integrations and automation power of more advanced platforms, but it is a solid starting point.
Pricing: Free up to 50 conversations; Starter from $29/month
8. Crisp
Crisp is a multichannel messaging platform with a generous free plan that includes two seats. It brings together live chat, email, and social messaging in one shared inbox.
It is a practical, cheaper alternative to Intercom for startups and small teams. Paid plans unlock chatbots and more advanced automation.
Pricing: Free for two seats; Pro from $25/month
9. Zoho Desk
Zoho Desk is the support module within the Zoho software suite. Its biggest advantage is how tightly it connects with Zoho CRM, giving sales and support teams a shared view of every shopper.
If your brand already uses Zoho products, Desk is a natural fit. If you don't, the value of the integration is less compelling.
Pricing: Standard plan starts at $14/agent/month
10. Front
Front is a collaborative inbox tool that brings email, SMS, and social channels into one shared workspace. Teams can assign conversations, leave internal comments, and track response times without switching tools.
Front is strong for collaboration but lighter on traditional helpdesk features like ticket routing and automation rules. It suits teams that manage a high volume of email and need better internal coordination.
Pricing: Starter plan starts at $19/seat/month
11. Gladly
Gladly organizes all customer communication into a single, ongoing conversation thread — no ticket numbers, no channel silos. Agents always see the full picture, regardless of where the shopper reached out.
This model works well for premium brands that prioritize a personal, high-touch experience. The price point reflects that focus.
Pricing: Hero plan starts at $150/agent/month
12. LiveAgent
LiveAgent is an all-in-one helpdesk that includes live chat, email, a call center, and a knowledge base in a single platform. It is one of the most affordable options with a broad feature set.
The interface feels dated compared to newer tools, but the functionality is solid for brands that want everything in one place without a high price tag.
Pricing: Small plan starts at $9/agent/month
13. HubSpot Service Hub
HubSpot Service Hub is the customer service layer of the HubSpot platform. It connects directly to HubSpot CRM, giving support teams full visibility into a shopper's marketing and sales history.
For brands already running on HubSpot, it is a logical extension. For those who aren't, adopting the full suite just for support is a significant commitment.
Pricing: Starter from $20/month for two users
14. Salesforce Service Cloud
Salesforce Service Cloud is one of the most powerful and customizable support platforms available. It handles complex workflows, advanced automation, and deep reporting at enterprise scale.
The tradeoff is complexity. Implementation takes time, requires technical resources, and the cost scales quickly. It is best suited for large brands with dedicated operations teams.
Pricing: Starter from $25/user/month; Enterprise from $165/user/month
15. Groove
Groove is a simple helpdesk for small teams that have outgrown shared Gmail inboxes. It includes a shared inbox, knowledge base, and basic reporting without the overhead of a larger platform.
It is a practical, no-frills option for brands with low ticket volume and straightforward support needs.
Pricing: Standard plan starts at $16/user/month
How to choose an Intercom alternative for ecommerce
The right platform depends on three things: your ecommerce stack, your ticket volume, and what you need the tool to do beyond answering questions.
Start with your platform. If you run on Shopify, you need a tool that connects natively — not through a workaround. Native integration means agents can see order details, edit shipments, and process returns without switching tabs.
Then think about scale. Per-agent pricing works well for small teams but gets expensive fast. Ticket-based pricing, like Gorgias uses, scales more predictably as your volume grows.
Finally, decide whether you need support only or support and sales. Some platforms on this list handle tickets well. Others — like Gorgias — are built to drive revenue through conversations, not just resolve them.
Key questions to ask any vendor:
- Does it integrate natively with your ecommerce platform
- What is included in the base plan versus add-ons
- How long does onboarding typically take
- How does pricing change as your ticket volume grows
- What automation is available without custom development
Next steps to evaluate Intercom alternatives
Most platforms offer a free trial or starter plan. Use it. A week of real usage tells you more than any feature comparison chart.
For Shopify brands that need more than Intercom offers, Gorgias is worth a closer look. You get native order management, 60% automation coverage, and no per-agent pricing. Start a free trial to see it on your actual workflows.
Gorgias AI Agent Pricing, Explained
TL;DR:
- AI Agent is priced per resolved interaction, not per seat or per message. You only pay when the AI fully resolves a conversation on its own.
- Most plans are $0.90 per resolved interaction. Starter plans begin at $1. Plans include 90 to 2,500+ automated interactions per month.
- If you go over your plan, overage fees apply per additional interaction. Rates vary by tier and are lower on annual plans.
- Your automation rate emerges from usage over time. Start by estimating your ticket volume and pick an interaction allotment that fits.
- AI Agent runs on email, chat, and SMS, and includes tone of voice customization, Actions, multi-language support, vision, and performance reporting.
If you're wondering what it costs to add AI Agent to your Helpdesk, you're in the right place. This article walks through how pricing works, what counts as a billable interaction, and how to think about the investment before talking to anyone on our team.
The good news: there are no seat fees, no per-message charges, and no token-based billing. You pay for conversations your AI actually resolves. If you've looked into other AI tools for customer support and found the pricing models confusing or hard to predict, Gorgias AI Agent works differently.
What is a billable interaction?
A billable interaction is counted when the AI resolves a customer conversation entirely on its own. The customer asks something, the AI handles it, the conversation closes. That's one interaction.
If the AI can't fully resolve a conversation and hands it to a human agent, that ticket shifts over to your regular Helpdesk plan. It becomes a standard resolved ticket. You're not charged for both.
A few things that don't count as billable interactions:
- Emails that come in but no one replies to
- Spam or filtered messages
- Conversations resolved by a human agent
This matters most for brands coming from seat-based tools. With Gorgias, your whole team can work in the platform. Agent seats are unlimited. Pricing scales with what your AI is actually doing, not with how many people have access.
Understand the difference between seat-based vs. usage-based pricing.
How AI Agent plans work
AI Agent is an add-on to your Gorgias Helpdesk plan. The two are priced separately but work together. Your Helpdesk plan covers all the conversations your human agents resolve. Your AI Agent plan covers the interactions the AI resolves on its own.
When you choose a plan, you select how many automated interactions you want included per month. Depending on your plan, that ranges from 90 to 2,500+ interactions, with custom interaction numbers available for enterprise. You can see the full breakdown on the Gorgias pricing page.
Each resolved conversation costs $0.90 on most plans. Starter plans begin at $1 per resolved conversation. You only pay for fully automated interactions, meaning conversations the AI handles from start to finish without a human stepping in.
Choosing the right plan
The main input is your average monthly ticket volume. From there, you estimate how many of those conversations AI could realistically handle on its own.
Order status updates, return requests, and shipping questions tend to be the highest-volume ticket types AI resolves well. AI Agent actions shows the full range of what it can handle, which makes it easier to estimate your starting number.
Your actual automation rate, meaning the share of total tickets the AI ends up resolving, emerges from usage over time. Most brands start with their most repetitive ticket types and expand from there as they see results.
Related: Which Gorgias plan should you choose?
What happens if you go over your plan
You're charged an overage fee for each additional automated interaction if you exceed your plan's baseline in a given month. The exact rate depends on your plan tier and whether you're on a monthly or annual subscription.
Generally, the higher your plan tier, the lower your overage rate. Annual plans also carry lower overage rates than monthly plans. So if you're regularly going over, upgrading to a higher tier or switching to annual often works out cheaper than paying overage fees month after month.
If you're on a Support + Shopping Assistant plan, the overage rate is $1.50 per interaction across all paid tiers. If you're on a Support-only plan, rates range from $1.00 to $2.00 per interaction on monthly plans, and $0.83 to $1.67 on annual plans, depending on your tier.
For seasonal businesses, forecasting your customer service volume before peak periods is the best way to choose the right plan size and avoid unexpected fees.
How to think about the cost
At $0.90 per resolved interaction on most plans, each AI resolution costs less than a human agent handling the same ticket. Once you know what a human-resolved ticket costs your business, the comparison becomes straightforward.
For brands building an internal case for the investment, how to pitch AI Agent to your boss covers the ROI framing in detail.
To see what results look like in practice, how 10 brands transformed customer support into revenue has real ecommerce examples.
What's included with AI Agent
AI Agent comes with everything you need to set it up, customize it, and improve it over time:
- Knowledge training — AI Agent learns from your Shopify data, store website, Help Center articles, URLs, documents, and custom guidance. The more content it has, the more accurately it responds.
- Tone of voice — set instructions for how AI Agent sounds, whether that's professional, friendly, or something else, and it stays consistent across every conversation.
- Actions — connect AI Agent to your other tools so it can complete tasks like cancelling an order, processing a return, or modifying a subscription without a human stepping in. See what AI Agent can do.
- Multi-language support — AI Agent detects the language a customer writes in and replies in the same language automatically.
- Vision — AI Agent can read and understand images, so it can handle tickets where customers share photos of damaged items or order issues.
- Performance reporting — track automation rate, CSAT, first-response time, and ticket topics directly in the dashboard.
- Testing — preview how AI Agent responds to real customer questions before going live or after making changes.
- Handover to humans — AI Agent automatically passes conversations to your team when it lacks confidence, detects frustration, or encounters a topic you've marked for human handling.
Learn more: Gorgias AI Agent guardrails: What they are and how to configure them
Curious what AI Agent would automate for your store?
The best way to get a sense of what AI Agent will cost is to look at your own ticket volume and the types of questions your customers ask most. From there, the right plan becomes much clearer.
If you want to talk through the numbers with someone from our team, book a demo and we'll walk through it with you.
If you'd rather keep exploring first, here are a few good next reads:
- AI Agent keeps getting smarter — the latest performance data across the Gorgias customer base
- 10 must-know AI Agent use cases — the ticket types brands are automating today
- How 10 brands transformed customer support into revenue — real ecommerce results
- How to customize AI Agent with 7 brand voice examples — what the experience looks like for customers
{{lead-magnet-2}}
Building delightful customer interactions starts in your inbox
