


Newsletter Signup
The best in CX and ecommerce, right to your inbox
Featured articles
Ticket Volume: How to Measure It, Benchmark It, and Reduce It
Gorgias AI Agent Pricing, Explained
Introducing Helpdesk 2.0: Built for How Agents Work
TL;DR:
- Built directly from agent feedback, Helpdesk 2.0 fixes real workflow pain points. The redesign focuses on reducing friction and helping agents handle more context-heavy tickets.
- A chat-style interface replaces the old email layout. Conversations are easier to follow and resolve in one view.
- Customer context is shown beside the conversation in a right-side panel. Agents can view history, orders, and details without leaving the ticket.
- AI handoffs come with clear summaries. Agents instantly see what happened, what was tried, and what to do next.
- Navigation is simpler and faster across teams. Clean menus, structured queues, and multi-store access keep agents moving efficiently.
Helpdesk 2.0 starts with the people who use it most: the agents.
We spent time understanding customer support from the agent's seat. What do they reach for constantly? What slows them down? What does a better workday look like?
Everything we found is in this brand-new update.
Why we redesigned Helpdesk
Conversational commerce is the new standard.
In customer support, this means customers expect context to remain intact wherever they reach out, whether a conversation starts on social, moves to email, or ends on a call.
This new approach to support has also changed the agent's role. Recurring tickets, like order status checks, shipping updates, and returns, are now handled by AI. What lands in the agent inbox are edge cases that require human judgment and troubleshooting, or tickets that require the full picture.
However, the original Helpdesk was built for a different era of support.
Context was separated across views rather than built into the conversation itself. It's something one in five Gorgias customers flagged, through support tickets, NPS surveys, and conversations with our team. So, we got to work.
Helpdesk 2.0 is the result.
What's new in Helpdesk 2.0
Here's a look at everything that changed.
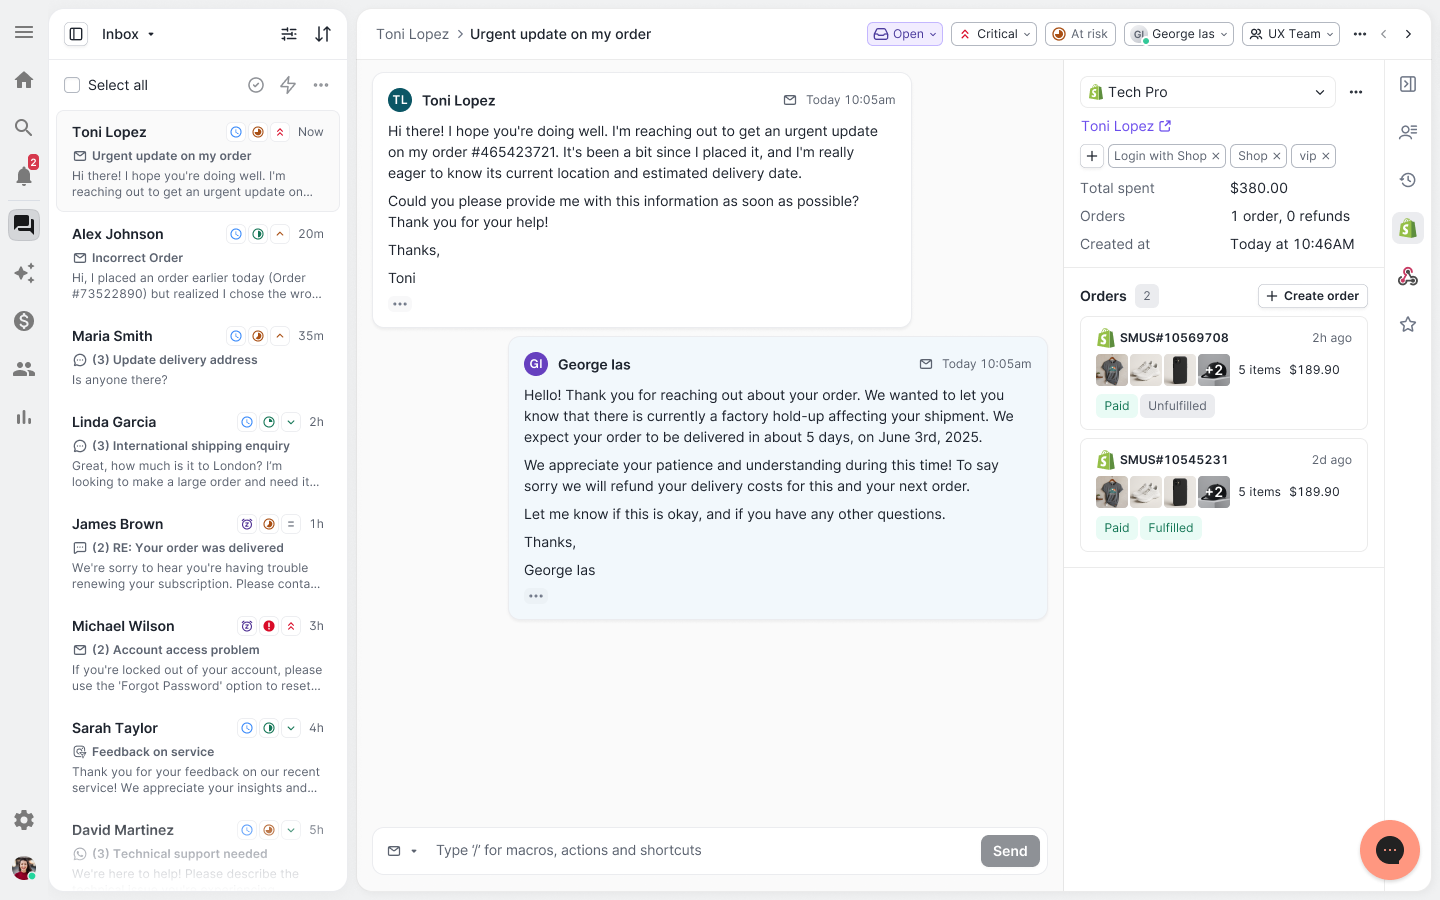
Read conversations the way they're meant to be read
Conversations have a natural rhythm, one that’s already found in every messaging tool we use. We brought that same layout into the helpdesk.
Say goodbye to the 2000s email interface and hello to chat bubbles. This updated design changes how quickly you can orient yourself and resolve the ticket in one go.
Chats with customers now look like real conversations, using the speech bubble style you’re familiar with on popular messaging apps.
Check customer history without losing your place
Checking a customer's history used to mean leaving the conversation, an extra step that interrupted what should have been a smooth workflow.
Now, past conversations open in a sidebar next to the active conversation. You can view a customer’s full history, search through their timeline, and open prior tickets without going to a new page.

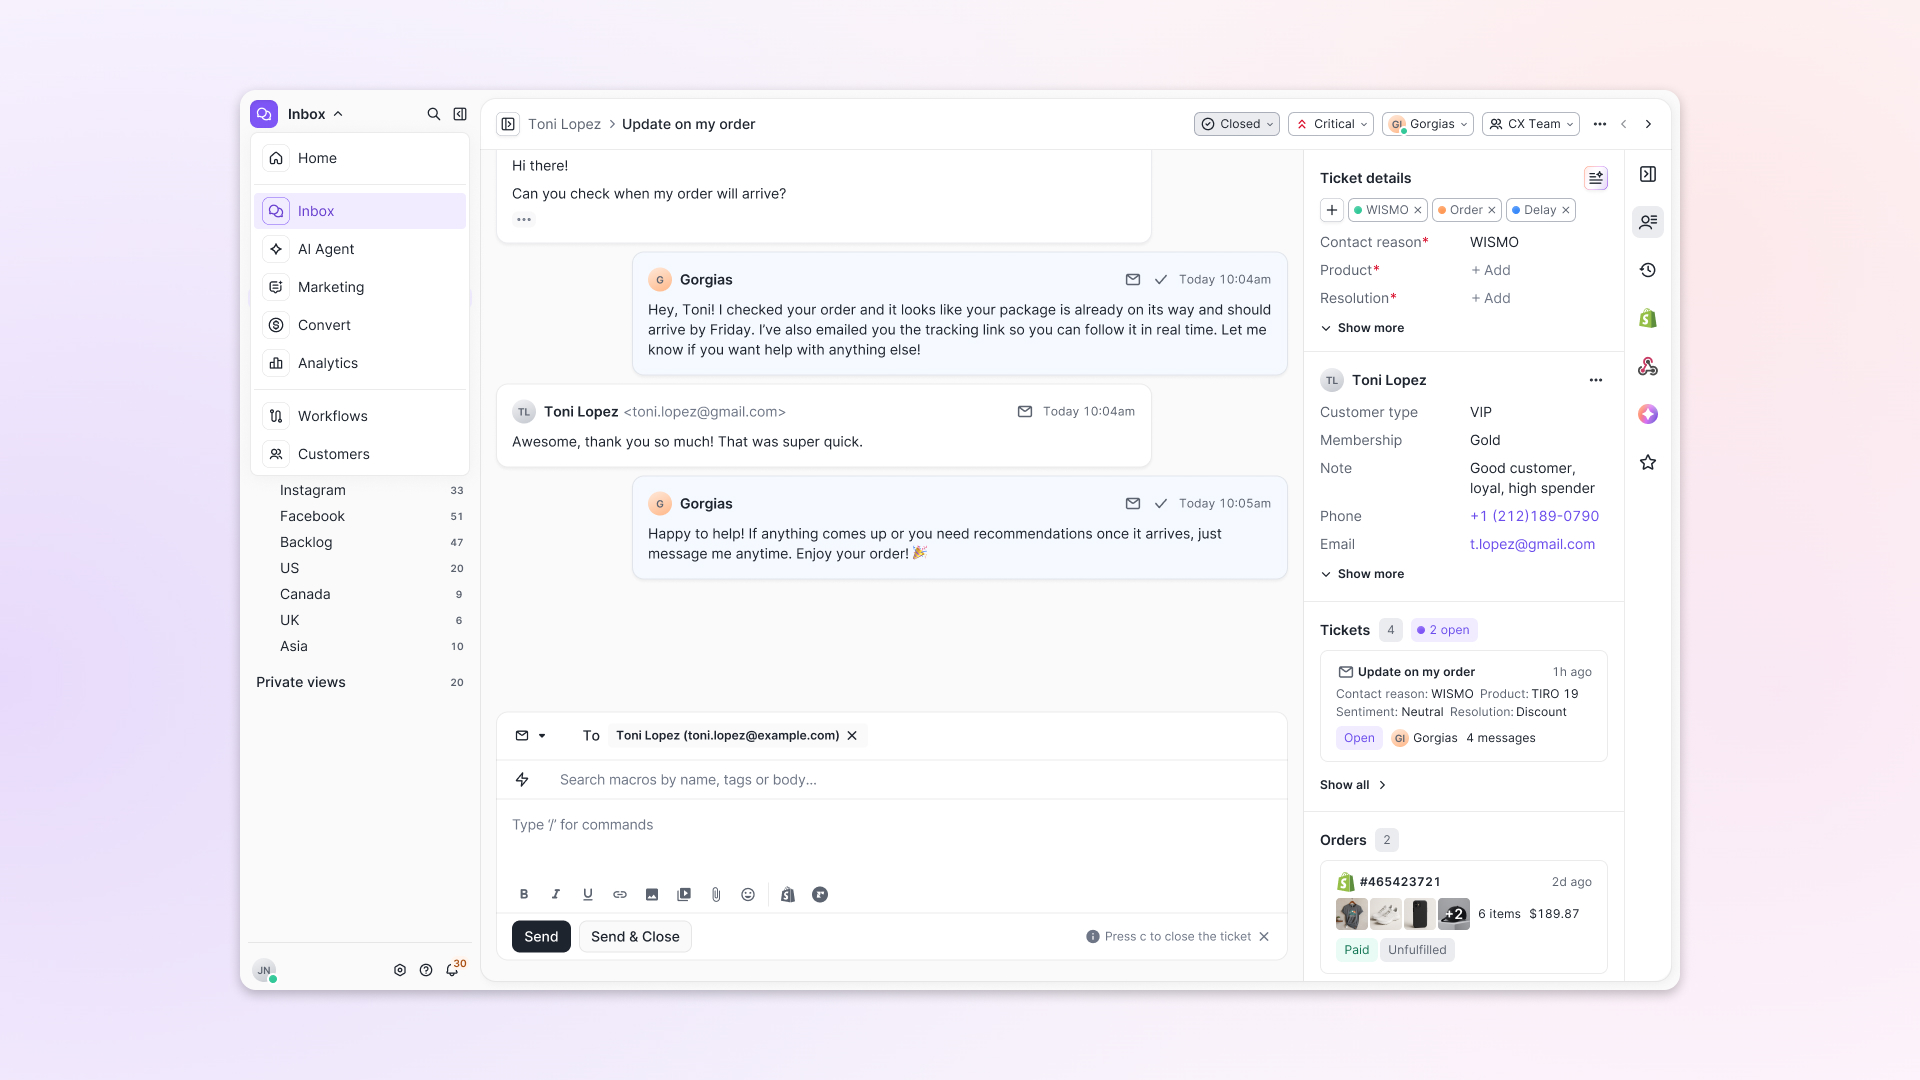
Check past conversations, orders, and customer details in the brand-new Customer Timeline.
See order details the moment you open a ticket
Order information is easier to reference than ever. Open a ticket, and you instantly see the customer's recent orders, marked with product images and invoice details at a glance. Need to dig deeper? Click on an order, and the expanded information appears in the same panel.
For teams using custom integrations, apps are fixed in a quick-access integration menu on the right.
See order details, product images, and totals at a glance on the right panel, without leaving the conversation.
Pick up where AI left off
You shouldn't have to dig through a thread to figure out what AI already tried. Now you don't have to.
When AI Agent escalates a conversation, it includes a concise handover summary that mentions the issue, what actions were taken, and why it was passed to your team.
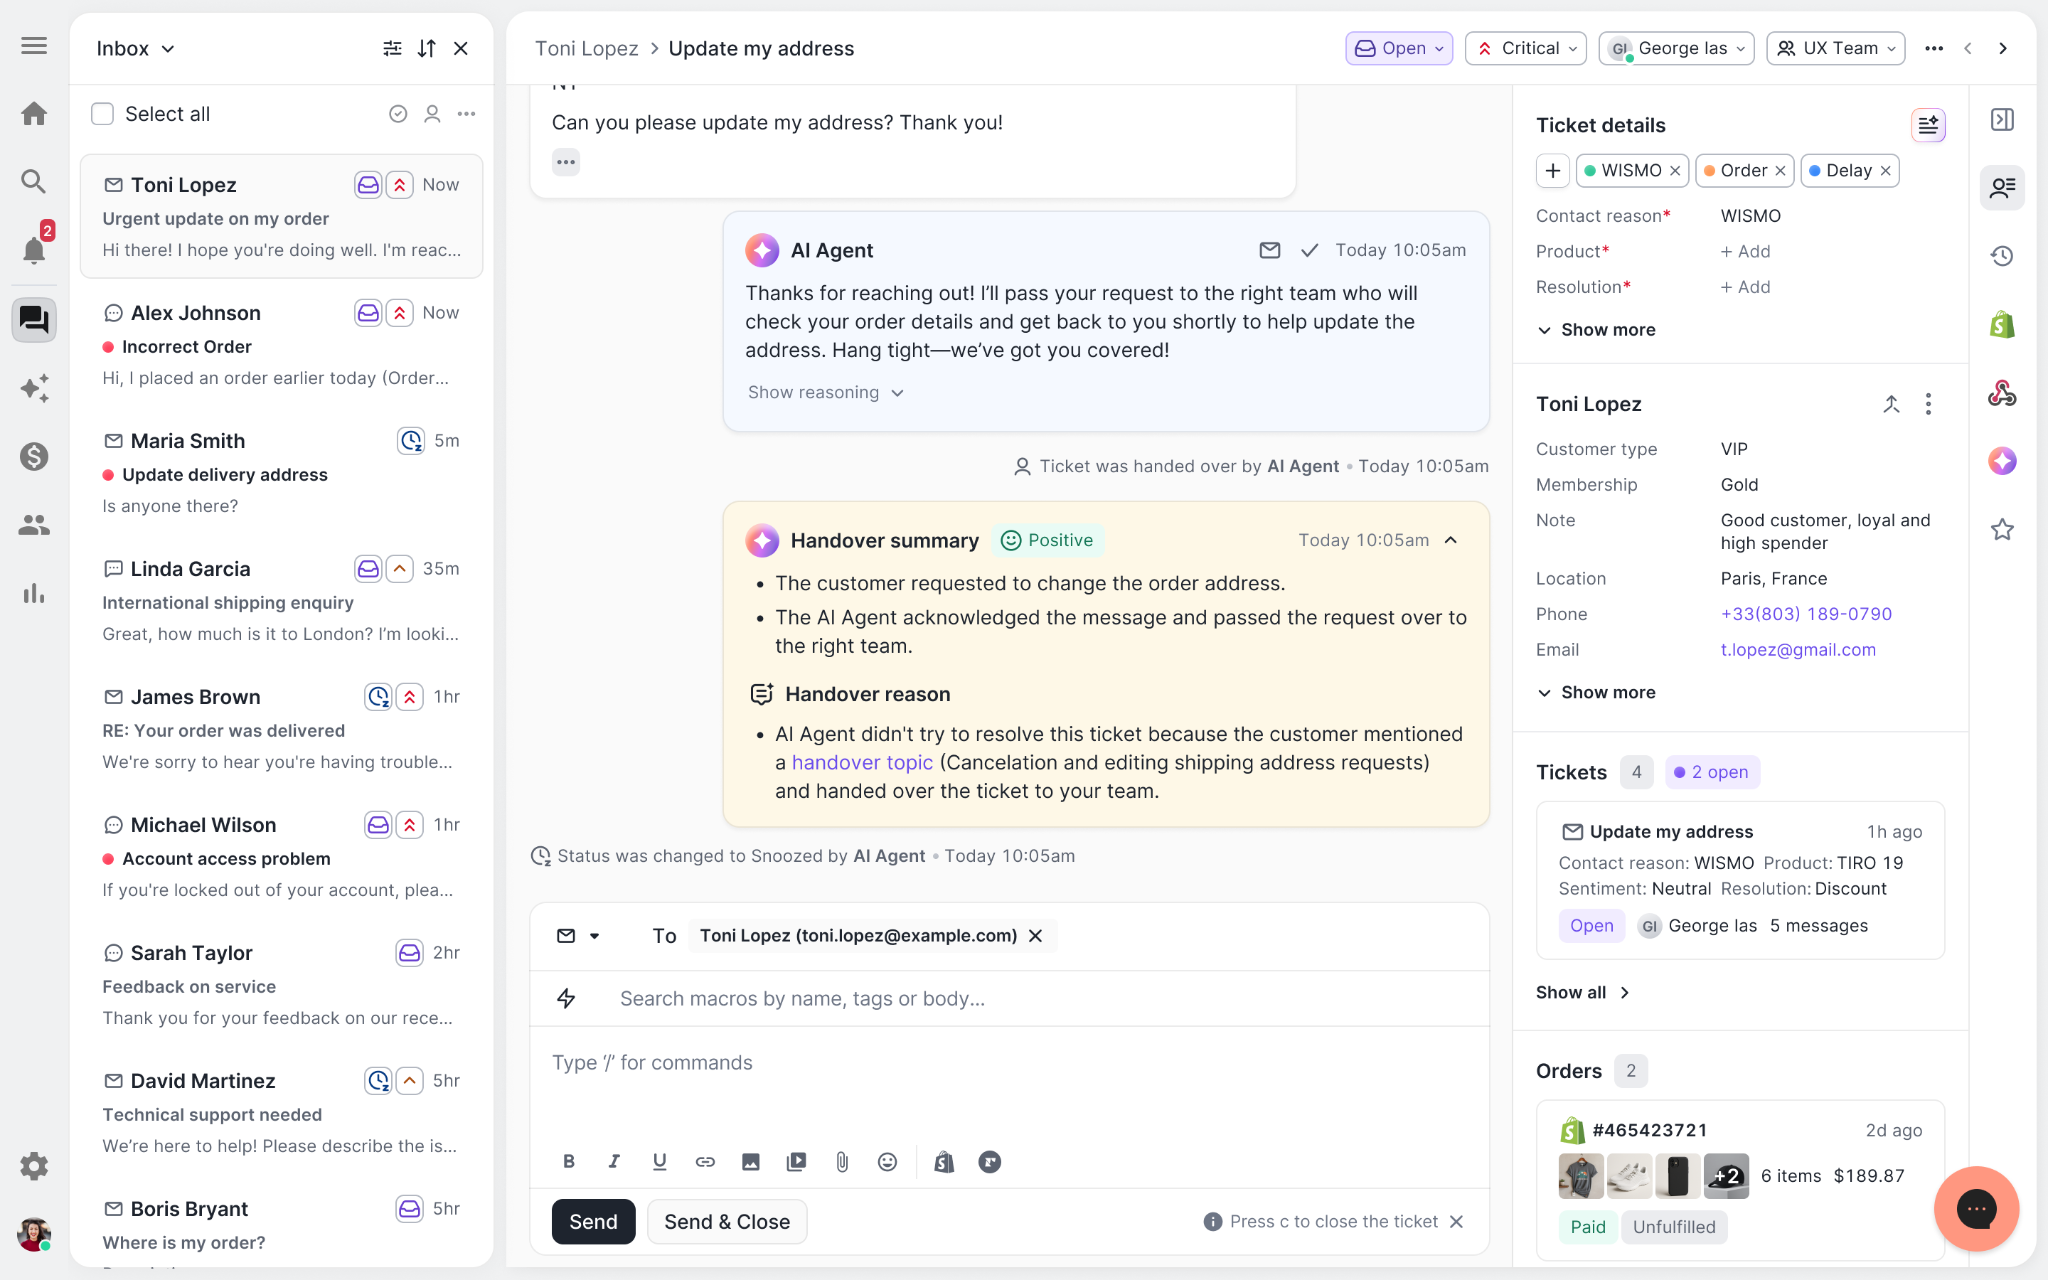
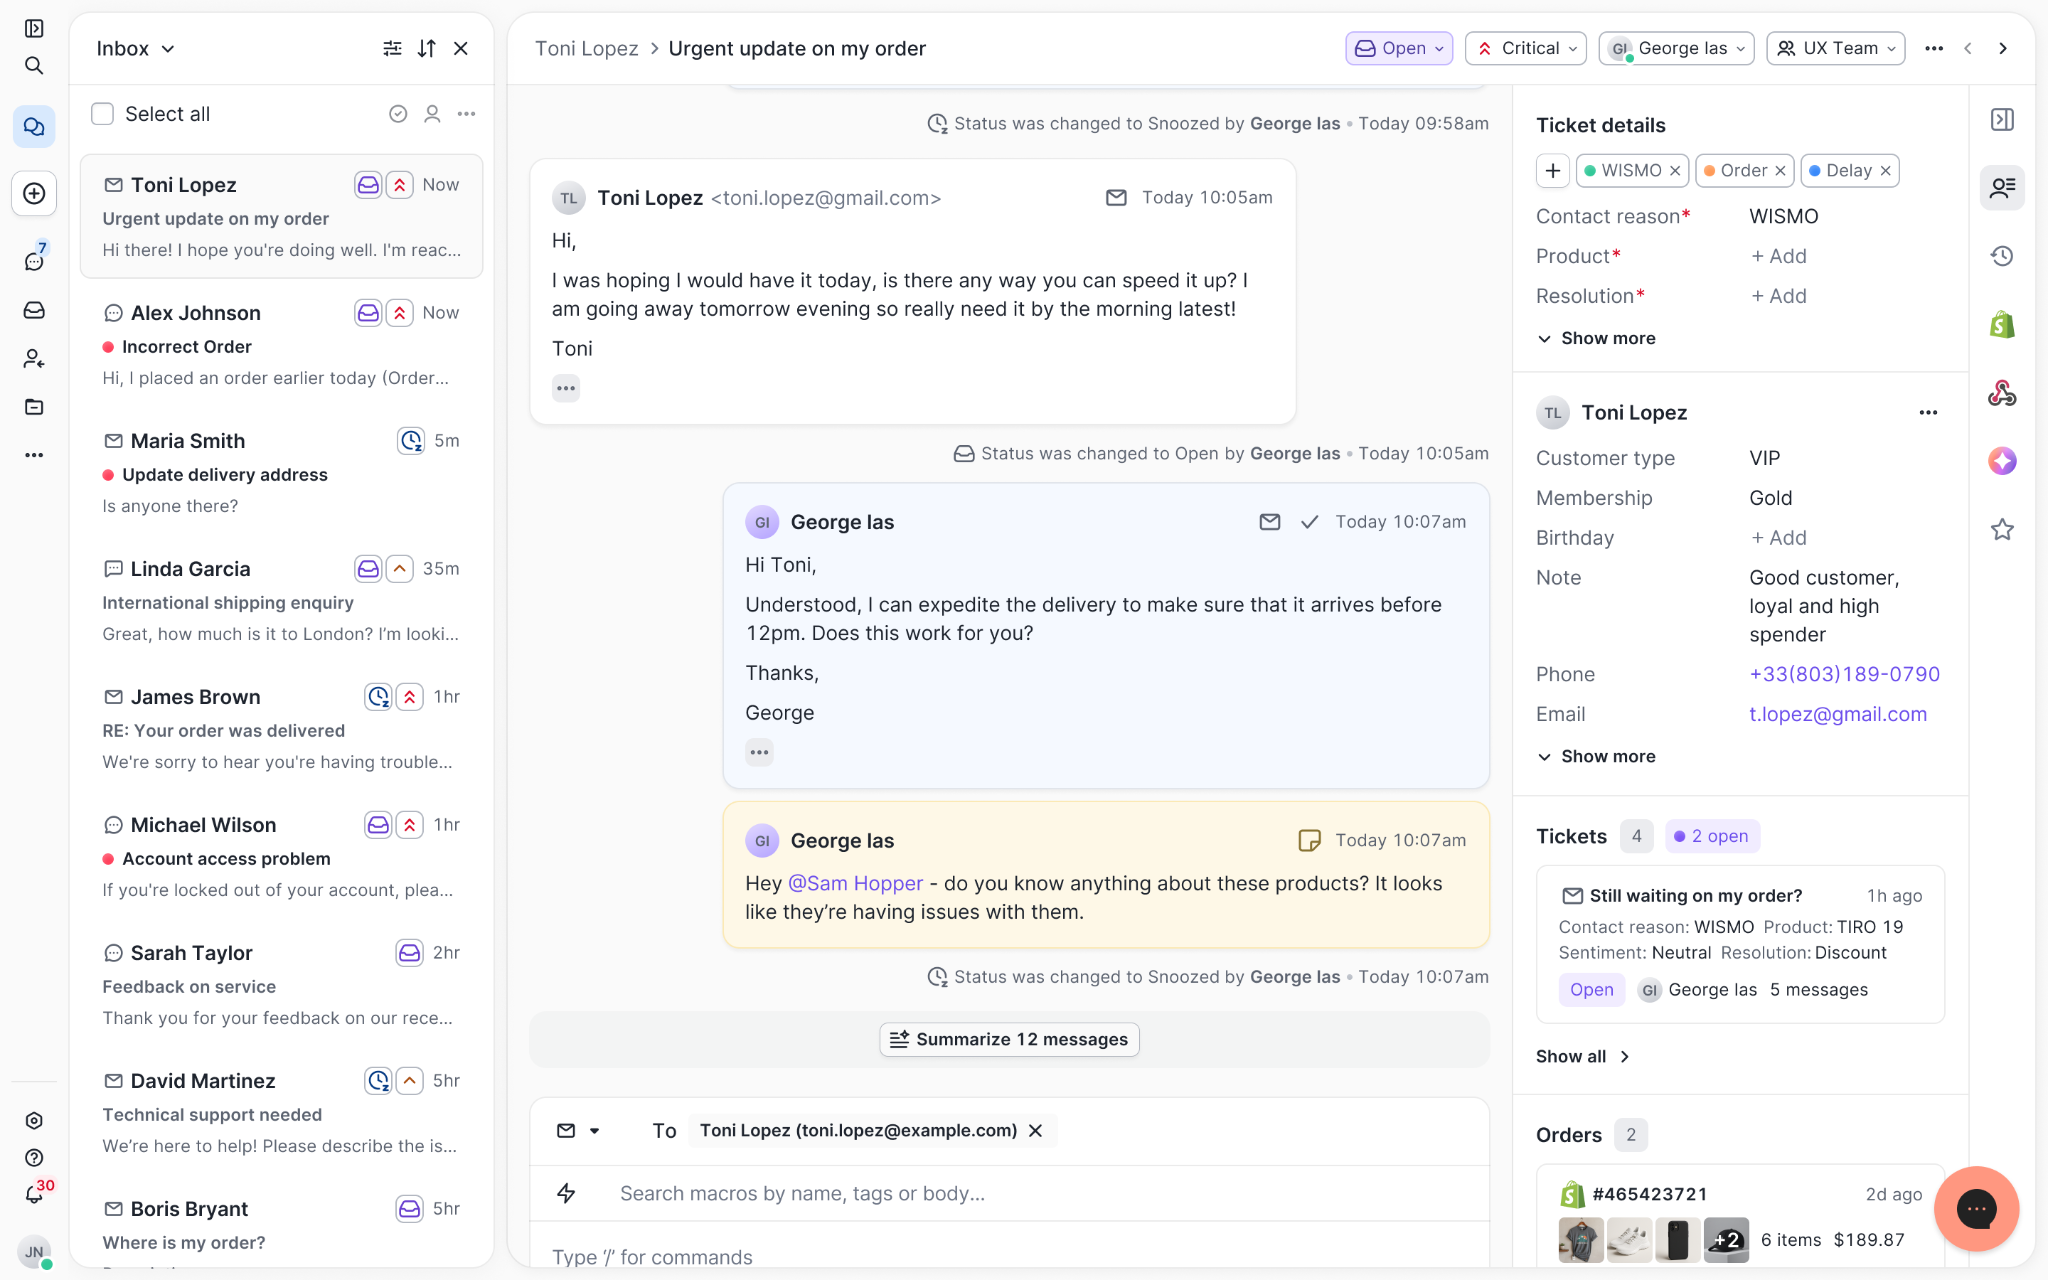
Escalated tickets include a brief AI-generated handover summary, marked in yellow, for quick reference.
Move faster across every store and team
We restructured and simplified the navigation. The left sidebar organizes everything into clear categories: Inbox, AI Agent, Marketing, and Analytics, so anyone on your team knows exactly where to go.
To quickly update your knowledge base or adjust a workflow, both now live right in the sidebar. For teams managing multiple stores, switching between them is just as straightforward, accessible from the sidebar, so agents can move between inboxes without breaking their flow.
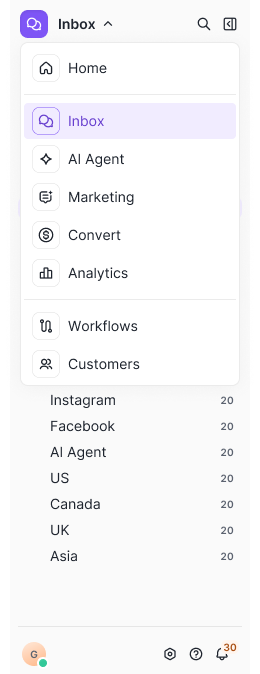
Agents can switch between stores and their corresponding inboxes directly from the left menu.
A workspace that works the way agents do
Support comes down to the person on the other end of the conversation. We built Helpdesk 2.0 is to make sure they have everything they need to show up for that moment.
The best way to see the difference is to work in it. Start a free trial today.


Further reading
7 CRO A/B Tests to Reduce Customer Support Tickets
Most ecommerce brands treat customer support as a post-purchase problem. It isn't. Plenty of tickets are written long before checkout — the moment a shopper can't find an answer, second-guesses the price, or doesn't trust what they're looking at.
At Blend Commerce, we see the same pattern again and again: when a product page answers buyer questions clearly, conversion goes up and support tickets go down.
This article breaks down seven conversion rate optimization (CRO) A/B tests you can run to head off support tickets before they happen — built on real buyer psychology, hands-on testing, and patterns we see across high-performing Shopify stores.
TL;DR
If your product pages answer these six buyer questions:
- Will it fix my problem?
- Is it worth the price?
- Do other people love it?
- What's my risk if it flops?
- How long will it take to arrive?
- Can I get help fast?
You'll get:
- Fewer pre-purchase tickets
- More confident buyers
- Stronger conversion rates
- Less pressure on your Gorgias inbox
The tests below show you how.
👉 Download: The Anatomy of the Perfect Product Page
Why most customer support tickets start on the product page
Before we jump into the tests, it’s important to understand why users contact support in the first place.
More tickets happen because users:
- Can’t find key information
- Want reassurance before buying
- Don’t trust pricing or value
- Are unsure about delivery or returns
- Need confirmation that help exists if something goes wron
Every one of these reasons maps directly back to unanswered buyer questions on the PDP. That’s where Conversion Rate Optimisation comes in.
The 6 buyer questions that drive support tickets and conversion
Most “Where do I find…?” or “Can you confirm…?” tickets don’t start in support. They start on the product page when something important isn’t clear enough.
Customers don’t consciously think, “I have a buyer question”. They feel uncertainty. That hesitation is what slows conversion and drives reassurance tickets.
These six buyer questions represent the friction points your PDP must resolve:
1. Will it fix my problem?
If the outcome isn’t obvious within a few seconds, users won’t keep digging; they either bounce or ask support to confirm it will work for them. This is especially true when users have edge cases like compatibility, sizing, and “will this work for X?” Strong benefit-first messaging and visible proof mean customers don’t need to double-check with your team before they buy. The page answers the question for them.
2. Is it worth the price?
Price objections rarely show up as “this is too expensive” in a ticket. They show up as:
- Can I get a discount?
- Is there a cheaper version?
- Why is this priced like this?
When the value isn’t clearly framed, users either abandon it or look for a human to justify the price. The right CRO elements make the value feel settled before the user has time to second-guess.
3. Do other people love it?
This is the reassurance question. When social proof is thin, generic, or hard to find, users seek confidence externally, often through support. Reviews, UGC, and “people like me” proof stop tickets like “Which one should I choose?” because the crowd does the persuading.
4. What’s my risk if it flops?
Risk is the silent conversion killer and a sneaky support-driver. If returns, exchanges, warranty, or guarantees aren’t clear, users ask preemptive “what if” questions to protect themselves. When you remove ambiguity around outcomes, you reduce tickets that exist purely to manage fear.
5. How long will it take to arrive?
Shipping ambiguity drives high-volume WISMO-style (where is my order) questions before purchase, not only after. If users can’t quickly find delivery cost, ETA, cutoffs, and tracking expectations, they’ll ask (or leave). Clear ETA messaging reduces tickets by removing the need for “can you confirm delivery to my area by X date?”
6. Can I get help fast?
Even confident users hesitate if they fear being stranded after checkout. Visible support options and expectations (how to reach you, response times, self-serve help) reduce “last-mile” tickets and increase conversion because users feel protected.
Let’s look at the A/B tests that directly reduce support tickets by answering these questions proactively.
7 CRO A/B tests that reduce customer support tickets
1. Add product page accordions to answer key buyer questions
Buyer questions addressed:
- 1. Will it fix my problem?
- 5. How long will it take to arrive?
- 6. Can I get help fast?
Why this CRO test reduces support tickets
Users often contact support because they cannot quickly locate delivery timelines, warranty details, return policies, compatibility information, or usage instructions. When key information is buried within long product descriptions, customers escalate to chat for reassurance before committing to purchase.
Introducing structured accordion sections brings clarity to the PDP, allowing shoppers to self-serve answers instantly without leaving the page or interrupting their buying journey.
Data signals that indicate this test is needed
- Support data signal: A high volume of pre-purchase tickets related to shipping, returns, product details, or compatibility questions.
- Behavioural signal: Repeated scrolling around policy content, frequent FAQ page visits, or heatmap friction near dense information blocks.
- Conversion signal: A strong Add to Cart Rate paired with a noticeable drop-off before checkout progression.
- Qualitative signal: Customer phrases such as “I couldn’t find…” or “Just checking before I buy…” appear consistently in chats.
- Action trigger: When clarification-based questions make up 15–20% or more of pre-purchase conversations, this test is typically high impact.
When these signals appear together, testing clearly labelled accordion menus on the product page (for example, Shipping, Returns, How It Works, and FAQs) allows users to self-serve the information they need without leaving the PDP.
What to include in your A/B test:
- Accordion layout vs long-form static content
- Shipping and returns information is positioned higher versus lower on the page
- Question-based section titles (e.g. “How long will delivery take?”) versus generic headings
Expected impact on support and conversion
- Reduction in clarification-based support tickets
- Improved mobile usability and scannability
- Lower PDP bounce rate
- Increased checkout progression
Real-life example & test results
In this case, support data and on-site behaviour revealed that customers were struggling to locate key product information on the PDP. Heatmaps showed repeated scrolling and hesitation around dense product descriptions, while competitor analysis highlighted a clearer accordion-based structure that made answers easier to access.
To test whether clarity was the issue, we introduced a structured accordion menu that grouped critical information such as delivery, returns, and product details into clearly labelled, expandable sections. Instead of forcing users to scan long blocks of text, the updated layout allowed them to quickly self-serve the information they needed.
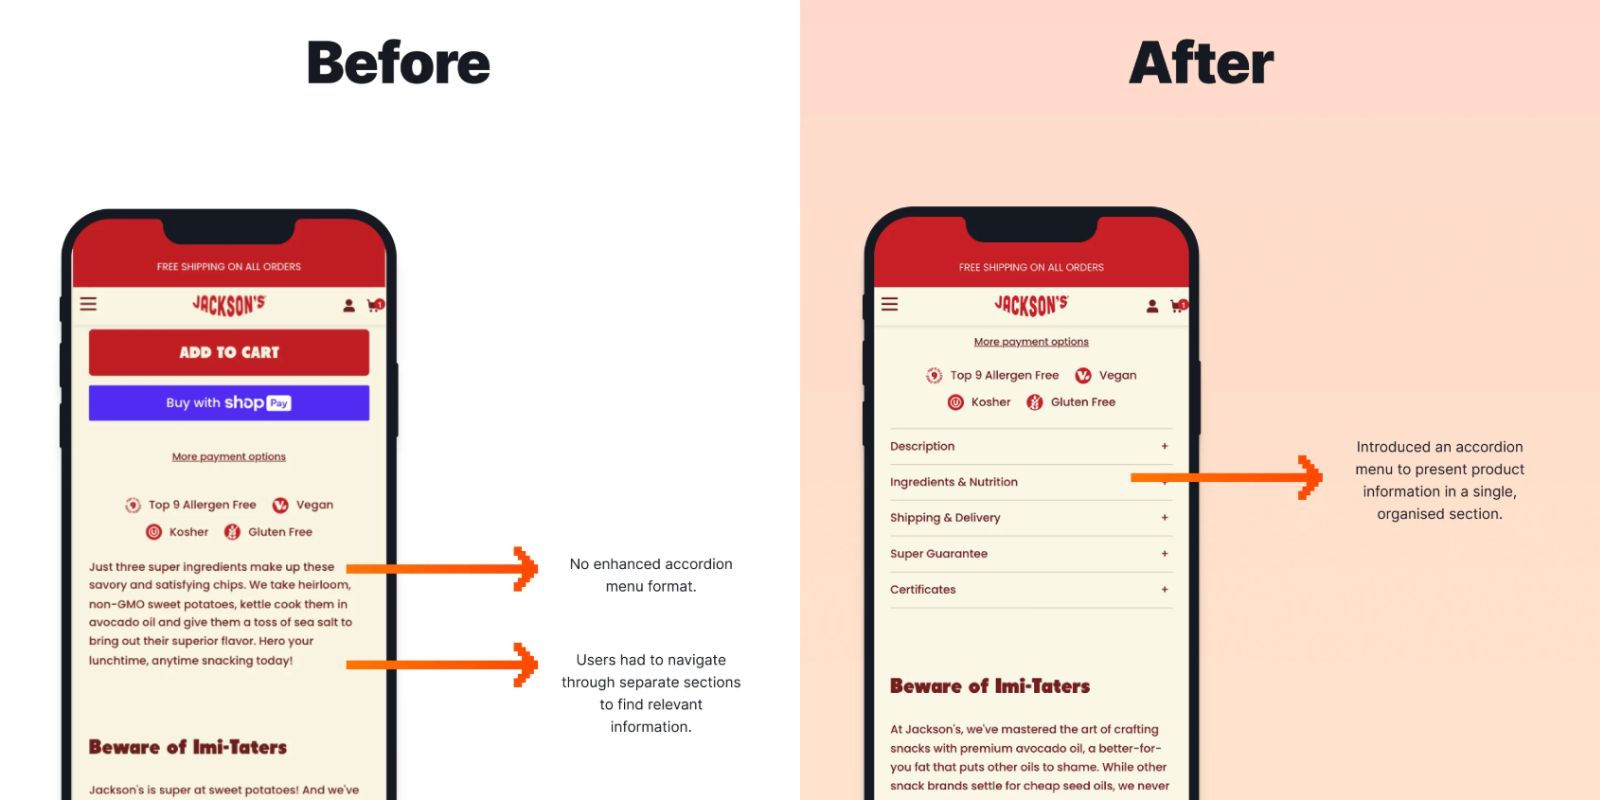
The results were significant. The variant delivered a +15.21% increase in Conversion Rate, a +6% increase in Add to Cart clicks, a +7.33% increase in Checkout visits, and a +22% increase in average session duration compared to the control.
The behavioural insight was clear: when information becomes easier to find, hesitation decreases. Users engaged more confidently with the page and were less reliant on support to clarify basic product details.
See the full A/B test breakdown here.
2. Test per-unit pricing to reduce pricing confusion
Buyer questions addressed:
- 2. Is it worth the price?
Why this CRO test reduces support tickets
Users frequently contact support to request discounts, verify pricing fairness, or clarify the total cost of the product over time. When only a total price is displayed, it can trigger immediate sticker shock, especially for higher-priced or subscription-based products.
Introducing per-unit or per-dose pricing reframes the decision. Instead of focusing on the total outlay, shoppers evaluate affordability in smaller, more digestible increments, such as price per day or per use. This reduces uncertainty and lowers the likelihood of pre-purchase pricing clarification tickets.
Data signals that indicate this test is needed
- Support data signal: Frequent pre-purchase tickets asking about discounts, promo codes, or pricing breakdowns.
- Behavioural signal: High product page engagement paired with a low Add to Cart Rate.
- Conversion signal: Weak subscription uptake, low Revenue per Visitor, or high drop-off after pricing exposure.
- Qualitative signal: Customer phrases such as “Do you offer promo codes?” or “Why is this so expensive?” appear consistently in chats.
- Action trigger: A noticeable increase in discount-related queries or subscription selection falling below category benchmarks.
When these patterns appear together, testing alternative pricing communication formats helps shoppers assess affordability instantly and reduces the need for reassurance from support.
What to include in your A/B test:
- Displaying price per dose alongside total price versus total price alone
- Pricing badges near the CTA versus explanatory copy below the Add to Cart button
- Price-per-day framing versus monthly cost framing
- Clear subscription savings callouts versus no explicit savings messaging
Expected impact on support and conversion
- Reduction in pricing clarification tickets
- Increased subscription opt-in
- Lower cart abandonment
- Higher Revenue per Visitor
Real-life example & test results
Support data and on-site behaviour revealed consistent pricing confusion on subscription PDPs. Customers were engaging heavily with pricing sections but hesitating before adding to cart, while support teams were fielding frequent discount and pricing clarification queries. The pattern suggested that shoppers were uncertain about the true cost of committing to a subscription.
To test whether clarity was the issue, we updated the PDP to display price per dose alongside the total price. Rather than presenting a single lump-sum figure, the revised layout introduced a clear “$X per dose” line directly beneath the headline price, aligning pricing communication with how customers naturally think about product usage and affordability.
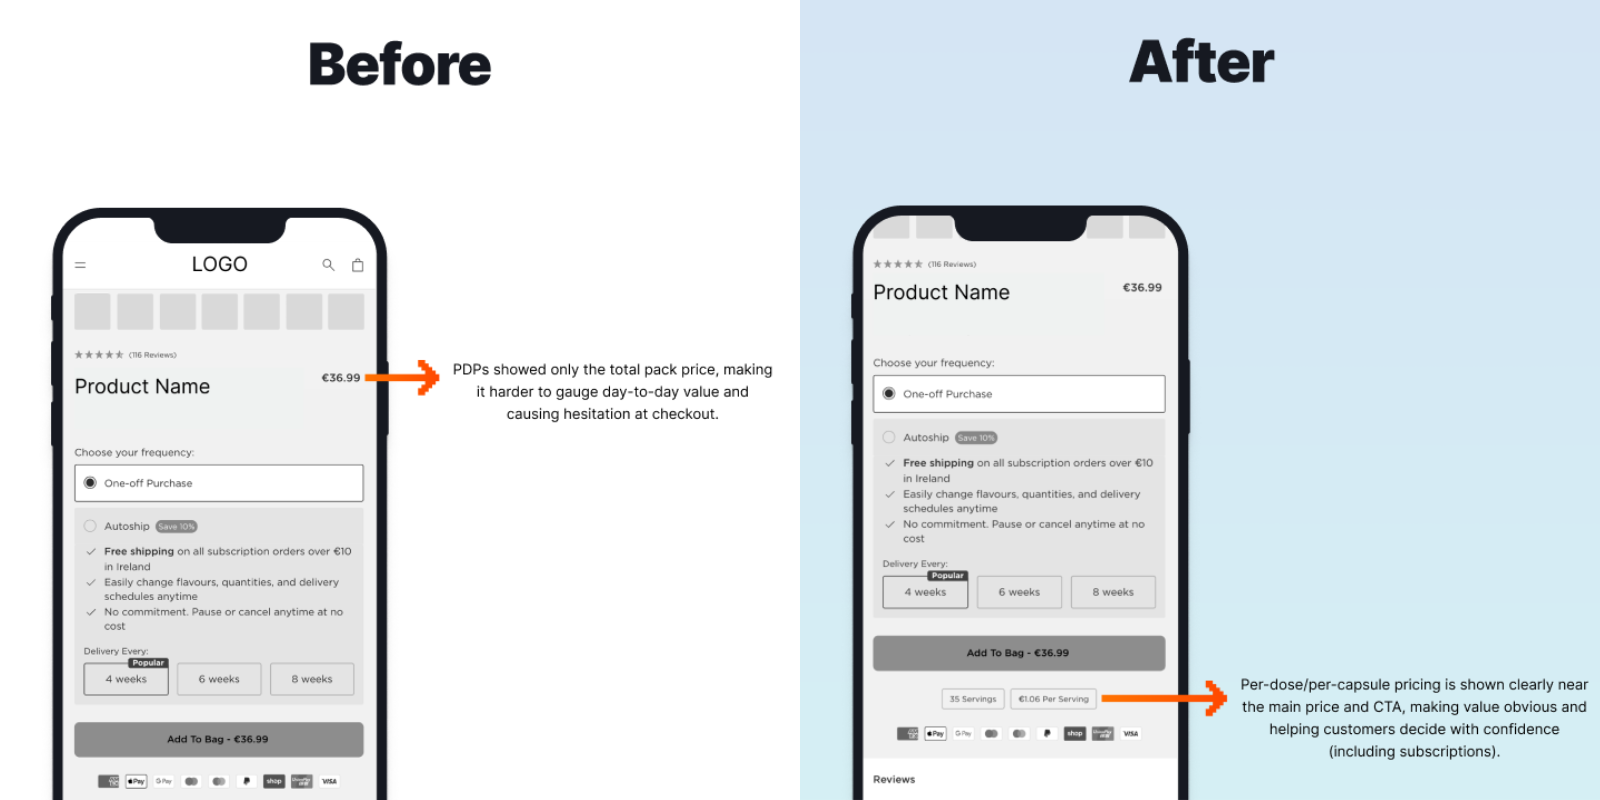
The results were measurable. The variant delivered a +5.55% increase in Conversion Rate, a +8.53% increase in Add to Cart Rate, and a +6.46% increase in sessions reaching checkout compared to the original layout.
The behavioural insight was clear: when pricing is reframed in smaller, contextual increments, shoppers assess affordability faster and with more confidence. Reducing cognitive friction around cost lowered hesitation and reduced the need for customers to contact support to validate pricing or perceived value.
3. Use reviews to reduce choice paralysis and support questions
Buyer question addressed:
- 3. Do other people love it?
Why this CRO test reduces support tickets
Customers frequently contact support not because something is broken, but because they are unsure which product to choose. When browsing a category with multiple similar SKUs, the absence of visible social proof forces shoppers to seek human reassurance before committing.
Displaying star ratings and review indicators directly on collection pages introduces trust earlier in the journey. Instead of waiting for the PDP to validate popularity or satisfaction, customers can quickly identify which products are favoured by others, accelerating decision-making and reducing comparison-based support tickets. Visible ratings reduce cognitive load by signalling popularity at a glance, preventing shoppers from over-analysing similar options.
Data signals that indicate this test is needed
- Support data signal: Frequent pre-purchase tickets asking “Which product is best?” or requesting help choosing between similar options.
- Behavioural signal: High comparison behaviour between similar SKUs, including repeated back-and-forth navigation between PDPs.
- Conversion signal: Low collection-to-PDP click-through rate or heavy traffic to “Best Sellers” and “Popular” filters.
- Qualitative signal: Customer phrases such as “What do most people buy?” or “Which one do you recommend?” appear consistently in chats.
- Action trigger: A broad product range with limited visible differentiation or unclear popularity indicators.
When these signals appear together, testing the visibility of reviews at the collection level, rather than limiting them to PDPs, helps customers make faster, more confident decisions without needing human reassurance.
What to include in your A/B test:
- Displaying star ratings on collection cards versus no visible ratings
- Adding “Customer Favourite” or “Top Rated” badges versus a neutral presentation
- Showing review count alone versus including short rating snippets
Expected impact on support and conversion
- Reduction in comparison-based support tickets
- Faster product selection and decision confidence
- Increased collection-to-PDP click-through rate
Real-life example & test results
During a CRO audit, we identified that product reviews were not visible on collection pages, leaving shoppers without immediate confidence signals while browsing. In a category where trust and product credibility heavily influence purchasing decisions, this absence contributed to choice overload and hesitation before users even reached a PDP.
To test whether earlier visibility of social proof would reduce friction, we added star ratings and review counts directly to product cards on the collection page. Instead of requiring users to click into individual products to validate quality, the updated layout made ratings instantly visible at a glance, allowing shoppers to compare options more efficiently.
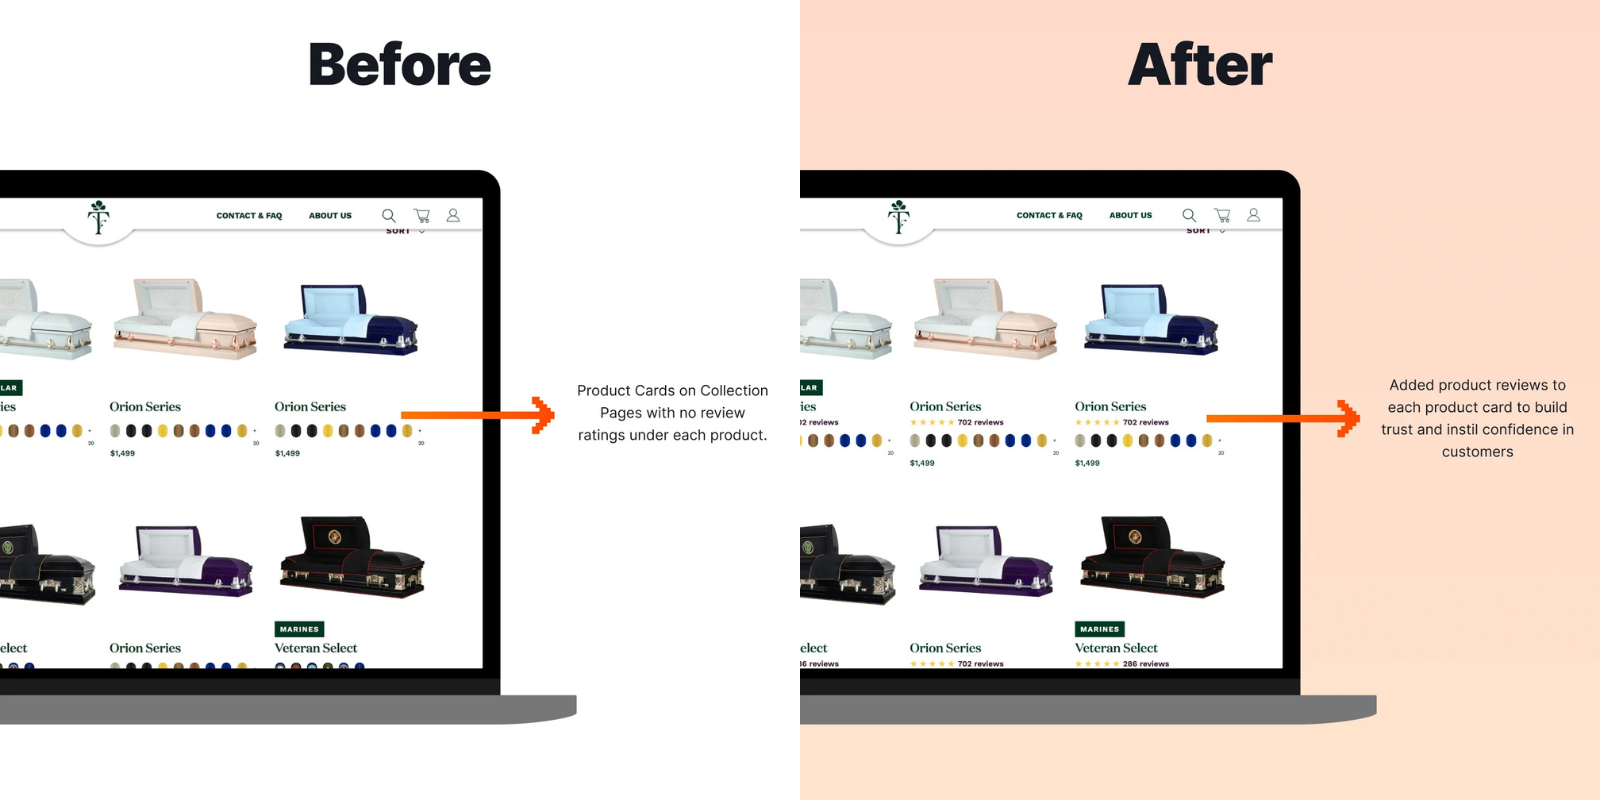
The impact was substantial. The experiment delivered a +23.2% increase in overall Conversion Rate and a +73.5% increase in Average Order Value across devices. Mobile performance was particularly strong, with a +69.9% increase in mobile Conversion and a +331.4% increase in mobile Revenue per Visitor compared to the control.
The behavioural insight was clear: surfacing social proof earlier in the browsing journey reduced cognitive friction and strengthened purchase confidence. When users could quickly identify highly rated products, they were more comfortable selecting multiple or higher-value items without seeking additional reassurance from support.
4. Highlight subscription benefits to reduce hesitation and support tickets
Buyer questions addressed:
- 2. Is it worth the price?
- 4. What’s my risk if it flops?
Why this CRO test reduces support tickets
Subscription hesitation is rarely about price alone. It is often driven by uncertainty around cancellation terms, pause or skip flexibility, and the perceived commitment involved. When these concerns are not addressed clearly at the point of selection, customers escalate to support to confirm their risk before proceeding.
Making subscription benefits and flexibility visible near the CTA reduces perceived commitment anxiety. Clear reassurance, such as “Cancel anytime” or “Pause or skip at any time”, lowers friction and removes the need for pre-purchase clarification tickets.
Reducing perceived commitment risk is often more impactful than increasing discount incentives, because customers fear being locked in more than they value small savings.
Data signals that indicate this test is needed
- Support data signal: Frequent pre-purchase tickets asking about cancellation policies, pausing options, delivery frequency, or subscription terms.
- Behavioural signal: High interaction with subscription selectors but low subscription uptake.
- Conversion signal: A strong skew toward one-time purchases despite competitive subscription incentives.
- Qualitative signal: Recurring customer phrases such as “Can I cancel anytime?” or “Am I locked in?”
- Action trigger: Low recurring revenue growth or subscription churn exceeding internal benchmarks.
When these patterns appear together, testing clearer subscription benefit messaging near the CTA helps remove commitment uncertainty before it becomes a support interaction.
What to include in your A/B test:
- Adding “Cancel anytime” or “Pause or skip anytime” reassurance near the subscription selector versus no visible flexibility messaging
- Displaying clear subscription benefit bullet points versus a standard toggle-only layout
- Embedding a short FAQ snippet near the selector versus requiring users to navigate elsewhere for policy details
Expected impact on Ssupport and conversion
- Increased subscription opt-in rate
- Reduction in reassurance-based support tickets
- Higher recurring revenue contribution
Real-life example & test results
In this case, subscription uptake was underperforming despite strong product interest and healthy PDP engagement. Support data revealed recurring pre-purchase questions about cancellation flexibility, pausing options, and perceived commitment risk. Churn levels also suggested that customers were either unclear about the terms at sign-up or hesitant to commit without reassurance.
To test whether clarity and risk framing were limiting adoption, we redesigned the subscription selector and surrounding PDP messaging. The revised layout made flexibility more explicit, highlighting benefits such as convenience and savings alongside clear reassurance copy like “Skip, Pause, or Cancel Anytime.” Instead of burying subscription details near the pricing block, the variation positioned flexibility messaging directly next to the selector so customers could evaluate value and risk instantly.
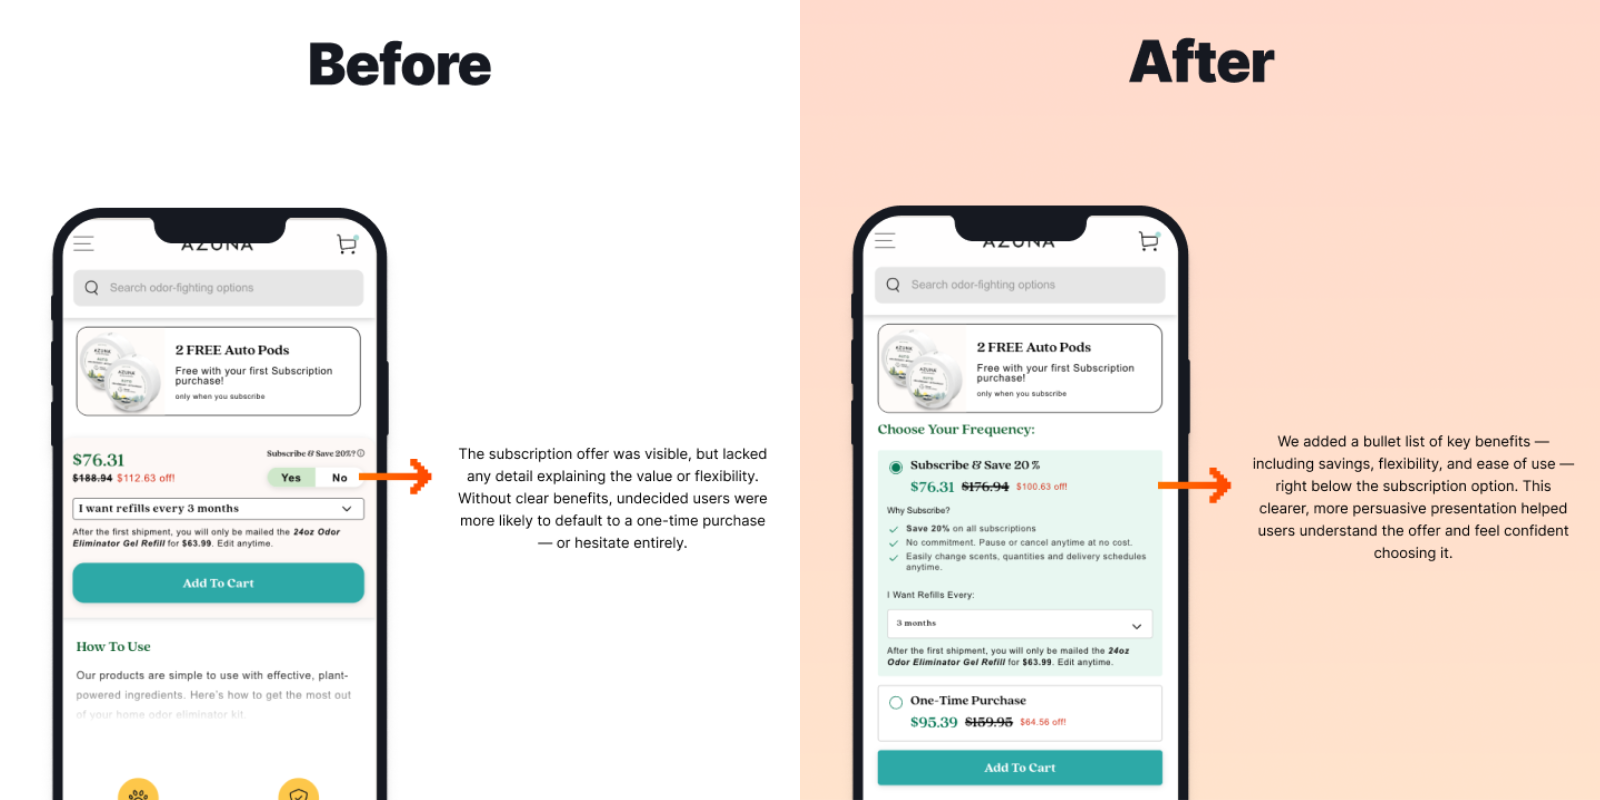
The result was a +32% increase in Subscription Orders per Visitor compared to the control, demonstrating that clearer communication of flexibility significantly improved subscription adoption.
The behavioural insight was consistent with risk psychology: when perceived commitment risk is reduced, customers are more willing to opt into recurring purchases. By addressing uncertainty at the point of decision, the test reduced hesitation and lowered the need for pre-purchase clarification from support, while simultaneously increasing recurring revenue.
5. Improve mobile navigation to reduce support queries
Buyer questions addressed:
- 5. How long will it take to arrive?
- 6. Can I get help fast?
Why this CRO test reduces support tickets
Mobile navigation friction often manifests as support tickets rather than immediate drop-offs. When key areas such as gift cards, shipping policies, returns information, or Help pages are difficult to locate on smaller screens, customers turn to chat as a shortcut.
On mobile, navigation clarity directly influences trust. If users struggle to find policy details or brand information quickly, support becomes the fallback mechanism for reassurance. Improving menu visibility and structure reduces this dependency by making essential information accessible within seconds. On mobile, clarity signals legitimacy. When navigation feels intuitive, brand trust increases before the user even reaches a product page.
Data signals that indicate this test is needed
- Support data signal: Frequent “Where can I find…?” tickets related to policies, gift cards, or Help pages.
- Behavioural signal: High mobile bounce rate or repeated navigation attempts within the menu.
- Conversion signal: A significant mobile versus desktop Conversion Rate gap not explained by traffic quality.
- Qualitative signal: Customer feedback referencing difficulty navigating or locating information on mobile.
- Action trigger: Mobile traffic accounts for the majority of sessions (often 60%+), amplifying the impact of navigation friction.
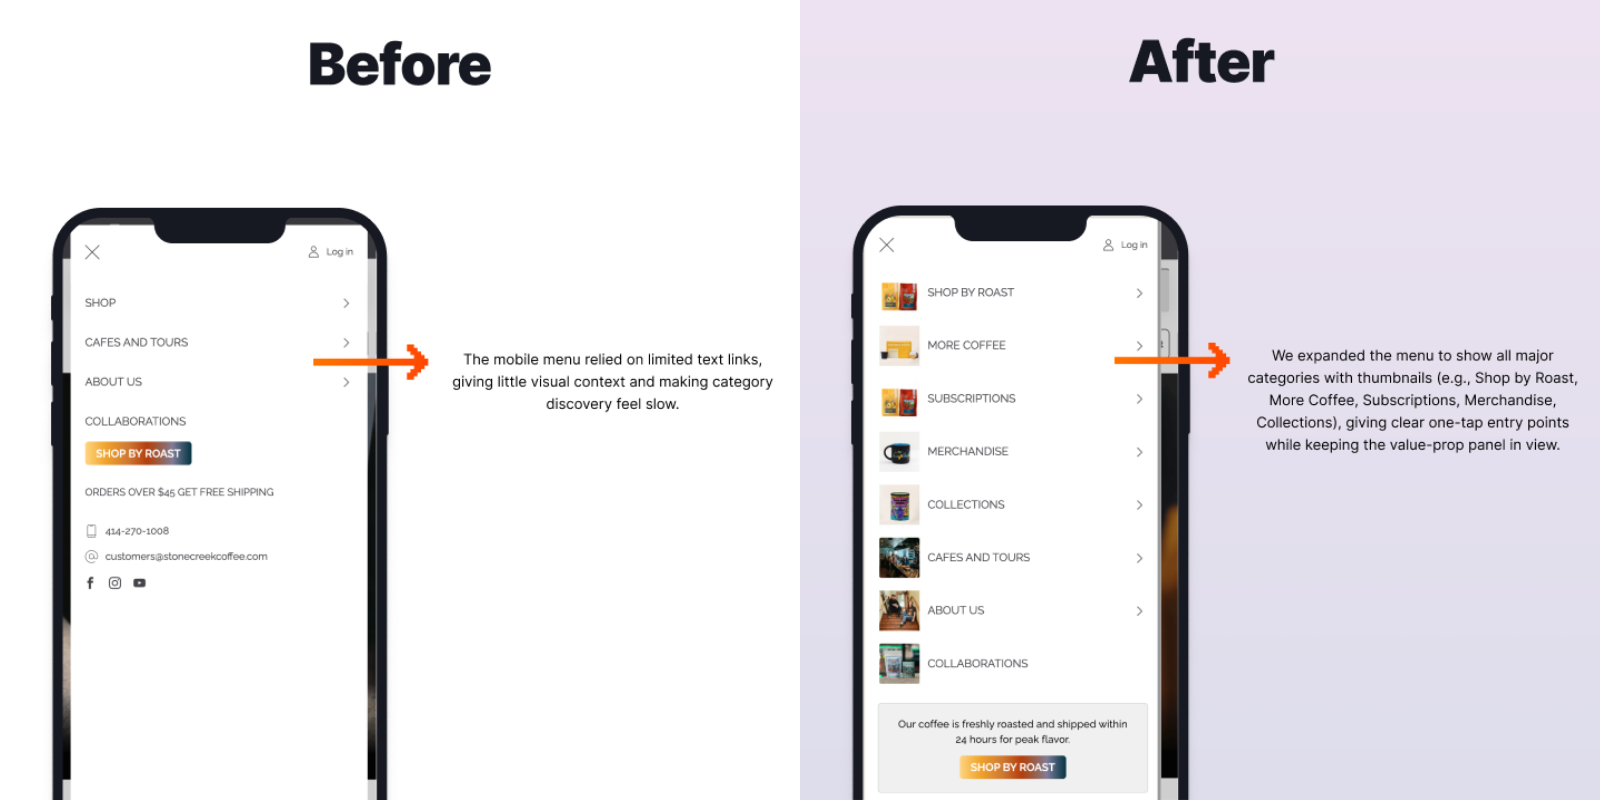
When these patterns appear together, testing a more visual and accessible mobile navigation structure improves information discovery and reduces reassurance-based support queries during browsing.
What to include in your A/B test:
- Visual category tiles versus text-only navigation
- Increased visibility of Help, About, and policy links within the primary menu
- Reordering categories based on purchase intent and traffic behaviour
Expected impact on support and conversion
- Reduction in navigation-related support tickets
- Higher mobile engagement across the browsing funnel
- Improved mobile Conversion Rate
Real-life example & test results
Analysis of site analytics revealed that mobile users were converting at a significantly lower rate than desktop users, despite comparable traffic quality. Session recordings and heatmaps highlighted repeated menu interactions, back-and-forth navigation, and shallow browsing depth, indicating friction in the mobile experience. Support tickets further reinforced the issue, with customers frequently asking where to find gift cards, return policies, and help resources on mobile.
To address this, we redesigned the mobile navigation into a more intuitive, visually structured menu that prominently surfaced key categories, Help & Policies, and support links. Rather than relying on a text-heavy, deeply nested structure, the revised version introduced a clearer hierarchy with icon-supported navigation and essential links positioned at the top of the menu.
The redesign delivered meaningful impact, including a +18% increase in Conversion Rate, a +28% increase in Revenue per Visitor, an +8% increase in Average Order Value, and a +6% increase in Subscription Revenue per Visitor compared to the original experience.
The behavioural insight was clear: when navigation becomes frictionless, product discovery expands. The visually led structure helped users find critical information faster while also exposing them to more categories. Improved clarity not only reduced reliance on support but also increased basket depth and subscription engagement, demonstrating that navigation structure directly influences both conversion performance and revenue growth.
6. Highlight reviews that answer common buyer questions
Buyer question addressed:
- 3. Do other people love it?
Why this CRO test reduces support tickets
Even when social proof is present, users often scan reviews for specific reassurance: Does it work? Will it arrive quickly? Is it easy to use? When these answers are buried deep within long review feeds, customers turn to support for direct confirmation before purchasing.
Customers rarely read every review. They scan for proof that someone like them has achieved the outcome they want.
Highlighting reviews that explicitly address common objections brings reassurance closer to the decision point. By surfacing objection-resolving testimonials near the CTA or product title, you reduce uncertainty and limit the need for live clarification.
Data signals that indicate this test is needed
- Support data signal: Frequent reassurance-based chats asking about results, delivery times, or suitability.
- Behavioural signal: High scroll depth within review sections before Add to Cart interaction.
- Conversion signal: Noticeable drop-off after users engage heavily with reviews.
- Qualitative signal: “Recurring phrases such as “Has this worked for someone like me?” or “Is it easy to use?”
- Action trigger: A strong review base, but low Add to Cart conversion relative to traffic volume.
When these signals appear together, curating and positioning objection-resolving reviews closer to the decision point reduces uncertainty and limits the need for pre-purchase reassurance from support.
What to include in your A/B test:
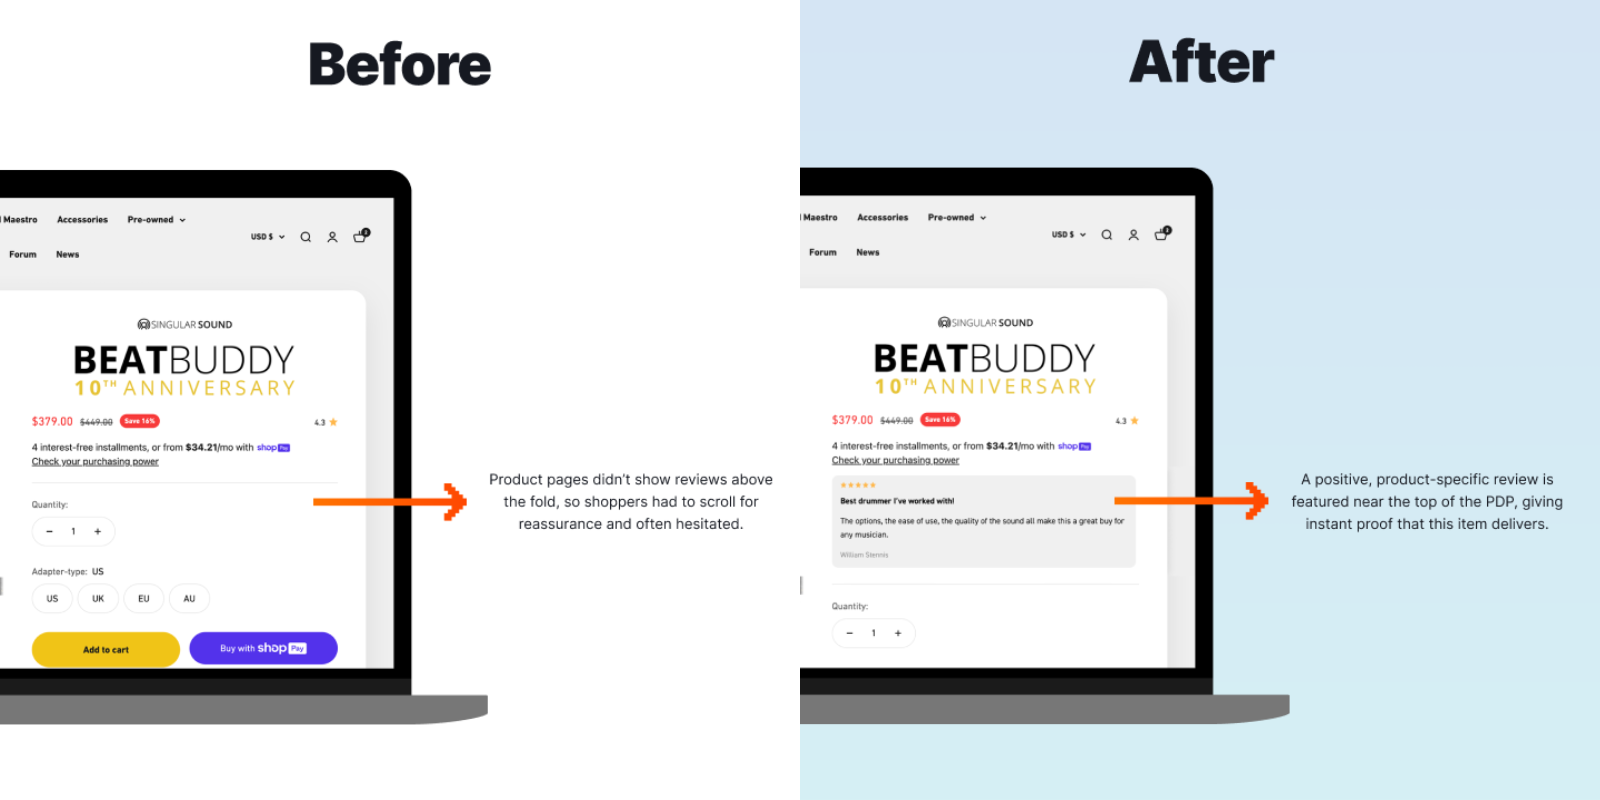
- Pinning an objection-answering review near the CTA or product title versus leaving reviews in chronological order
- Adding a “Most Helpful Review” badge versus a neutral presentation
- Displaying a short before-and-after or results-focused snippet above the fold versus relying on full review feeds
Expected impact on support and conversion
- Reduction in reassurance-based support tickets
- Increased Add to Cart Rate
- Higher Revenue per Visitor
Real-life example & test results
Site analytics and session recordings revealed that users were spending significant time within the review section but progressing weakly from reviews to Add to Cart. Heatmaps showed extensive scrolling behaviour, suggesting that shoppers were actively searching for reassurance before committing. The pattern indicated that social proof existed, but it was not positioned effectively within the decision-making flow. Users were not lacking proof; they were lacking proximity to proof.
To test whether placement was the issue, we pinned a highly relevant, objection-resolving review near the CTA. Instead of requiring users to scroll deep into the PDP to validate product effectiveness, the revised layout surfaced a strong use-case testimonial at the point of decision.
The variant delivered a +11.11% increase in Conversion Rate, a +6.48% increase in Add to Cart Rate, a +6.76% increase in Checkout Visit Rate, and a +2.78% increase in Average Session Duration compared to the control.
The behavioural insight was clear: when relevant social proof is integrated directly into the purchase decision area, hesitation decreases. Highlighting a trusted, outcome-focused review near the CTA transformed passive proof into an active confidence driver, reducing the need for reassurance-based support conversations.
Test homepage value messaging to reduce early-stage support questions
Buyer questions addressed:
- 3. Do other people love it?
- 4. What’s my risk if it flops?
- 5. How long will it take to arrive?
Why this CRO test reduces support tickets
Support tickets often originate before users ever reach a product page. When first-time visitors arrive on a homepage without immediately seeing shipping clarity, return guarantees, or support accessibility, uncertainty forms early in the journey.
If trust signals and risk-reduction messaging are not visible above the fold, customers either abandon or seek reassurance via chat. Addressing these concerns at the homepage level reduces early-stage hesitation and limits reassurance-based support interactions before product exploration even begins.
Early clarity compounds. When risk and legitimacy are established upfront, subsequent pages perform better.
Data signals that indicate this test is needed
- Support data signal: Frequent reassurance tickets from first-time visitors questioning legitimacy, delivery, or return policies.
- Behavioural signal: High homepage bounce rate or shallow session depth from new traffic.
- Conversion signal: Lower Conversion Rate from new visitors compared to returning users.
- Qualitative signal: Customer phrases such as “Is this brand legit?” or “What’s your return policy?” appear early in conversations.
- Action trigger: High volume of paid traffic acquisition without strong above-the-fold trust messaging.
When these signals appear together, testing clearer value propositions above the fold, including shipping, returns, and support availability, reduces early-stage doubt and strengthens trust before users navigate deeper into the site.
What to include in your A/B test:
- Displaying trust badges above the fold versus no visible trust reinforcement
- Featuring shipping and returns messaging within the hero section, versus burying it lower on the page
- Including a visible support availability statement versus requiring users to locate contact details elsewhere
Expected impact on support and conversion
- Reduction in early-stage reassurance tickets
- Increased trust among first-time visitors
- Higher first-session Conversion Rate
Real-life example & test results
During a CRO audit, we identified that the homepage lacked clear, above-the-fold value propositions such as shipping benefits, guarantees, and brand differentiators. For first-time visitors, particularly those arriving from paid traffic, this created an immediate trust gap. Users were being asked to explore the site more deeply before understanding what made the brand credible or distinct.
To test the impact of clearer positioning, we introduced two banner variations on the homepage.
Variant 1 emphasised broad, trust-based corporate messaging, while Variant 2 featured a more product-led value proposition strip positioned prominently near the top of the homepage. The goal was to determine whether specific, tangible differentiation would outperform general reassurance messaging.
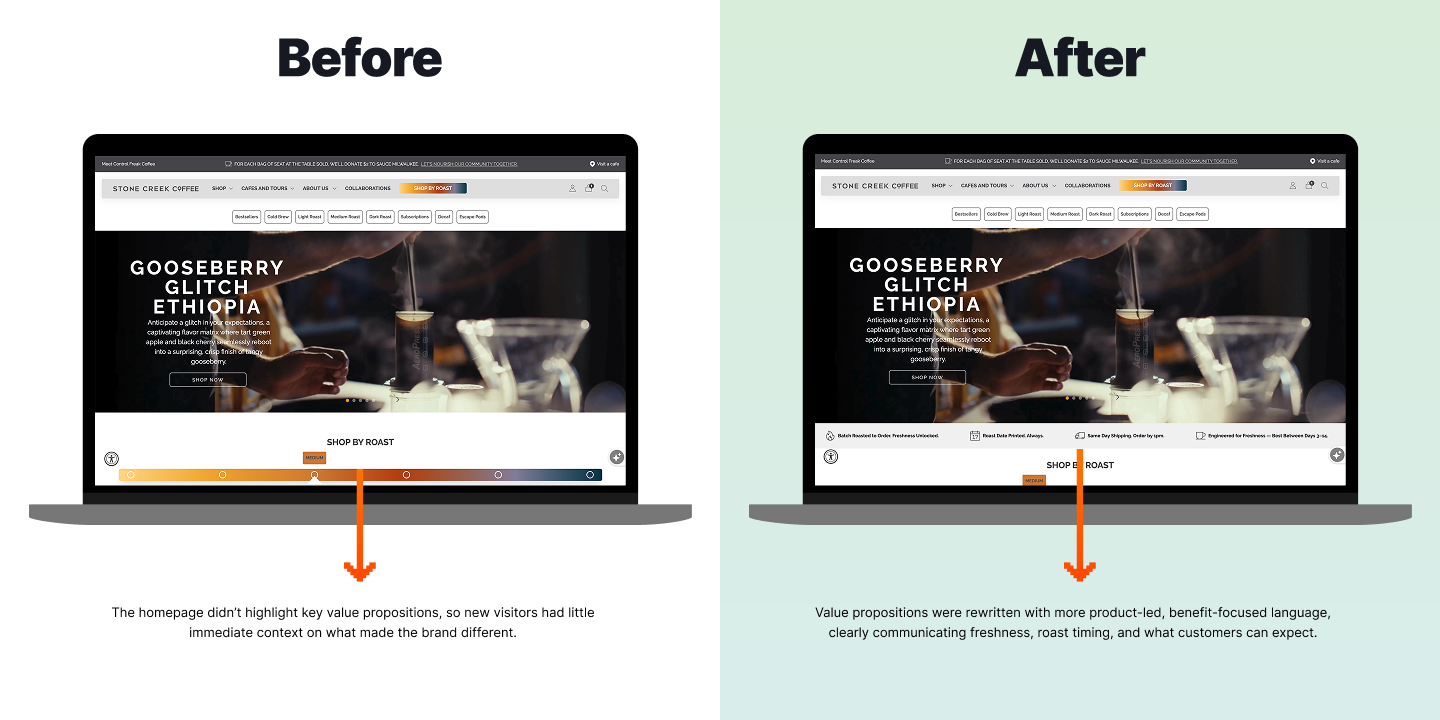
Before-and-after homepage comparison for a coffee retailer. The redesigned version introduces clearer, benefit-focused value propositions highlighting freshness, roast timing, and shipping speed, helping new visitors understand the brand’s key differentiators at a glance.
The results favoured clarity and specificity. Variant 2 delivered a +3% increase in Conversion Rate, a +5% increase in Revenue per Visitor, and a +18% increase in Subscription Revenue per Visitor compared to the original experience.
The behavioural insight was revealing: visitors responded more strongly to concrete product differentiation than to generic trust statements. When the homepage immediately communicated what made the product distinct and valuable, early-stage doubt decreased, and purchase confidence increased, without increasing reliance on support for validation.
Bonus tip: Use intent-based chat triggers to reduce low-quality support tickets
Instead of showing chat to everyone, test triggering Gorgias chat based on intent signals such as high cart value, high page depth, and known friction pages. This ensures the chat supports high-intent users without encouraging unnecessary tickets.
How CRO and Gorgias work together to reduce support tickets
Most teams use CRO to “increase conversion” and Gorgias to “handle tickets.” In reality, they are solving the same underlying problem: buyer hesitation. The best-performing brands connect them into one loop:
CRO prevents avoidable customer support tickets
A large chunk of your ticket volume is avoidable because it’s caused by missing clarity, not genuine support needs (pricing confusion, shipping uncertainty, basic product usage questions, reassurance). Your own A/B test list spells this out clearly: users contact support when they need missing information, trust, promo help, or confirmation that support exists.
When CRO closes those clarity gaps, Gorgias becomes more powerful because your agents spend more time on higher-value conversations rather than repeating the same answers.
Better self-serve content improves resolution time and conversion
Gorgias is basically a live feed of customer friction. The fastest way to build a high-impact CRO roadmap is to pull patterns from top ticket tags, most-used macros, and chat transcripts where users hesitate right before purchase. Those themes map almost perfectly to the 6 buyer questions and tell you which part of the PDP is causing confidence to leak.
How better self-serve content improves resolution time and conversion
When you add clearer answers on-site, like FAQs and policies, you’re not only reducing tickets, but also making the tickets that still occur easier to solve because customers arrive in chat already educated. This creates shorter conversations, higher CSAT (Customer Satisfaction Score), and fewer back-and-forth messages.
Intent-based targeting turns support into a conversion tool
When CRO reduces low-intent confusion, you can reserve live chat for moments that genuinely drive conversion. This is where CRO + Gorgias becomes a revenue lever: your chat doesn’t become a crutch for unclear pages, it becomes a precision assist for high-intent buyers.
The outcome: fewer tickets, better conversations
When these two work together, you don’t just reduce ticket volume. You improve ticket quality and increase revenue efficiency across the funnel.
Fix the questions before they become tickets
Most support tickets do not start inside Gorgias. They start earlier, when shoppers cannot find information, feel uncertain, or need reassurance before they buy. When your site answers the six core buyer questions clearly, conversion improves, pre-purchase tickets decline, support conversations become shorter, and customers move forward with greater confidence.
The fastest way to identify where this is happening on your site is to connect CRO analysis with your support data. Patterns in ticket tags, chat transcripts, and recurring customer questions provide a powerful signal for where clarity gaps exist and which tests will have the greatest impact.
If you want a structured framework to audit your product pages against these buyer questions, we have created a free resource that breaks down the exact elements high-performing PDPs use to reduce hesitation and support volume.

Conversations Are Becoming a Revenue Channel: The Data Proves It
TL;DR:
- Customer journeys are collapsing to a single conversation. The traditional browse-and-buy journey is giving way to AI-guided shopping that moves from discovery to purchase in a single exchange.
- 79% of brands say AI-driven conversational commerce has increased their sales and purchase rates.
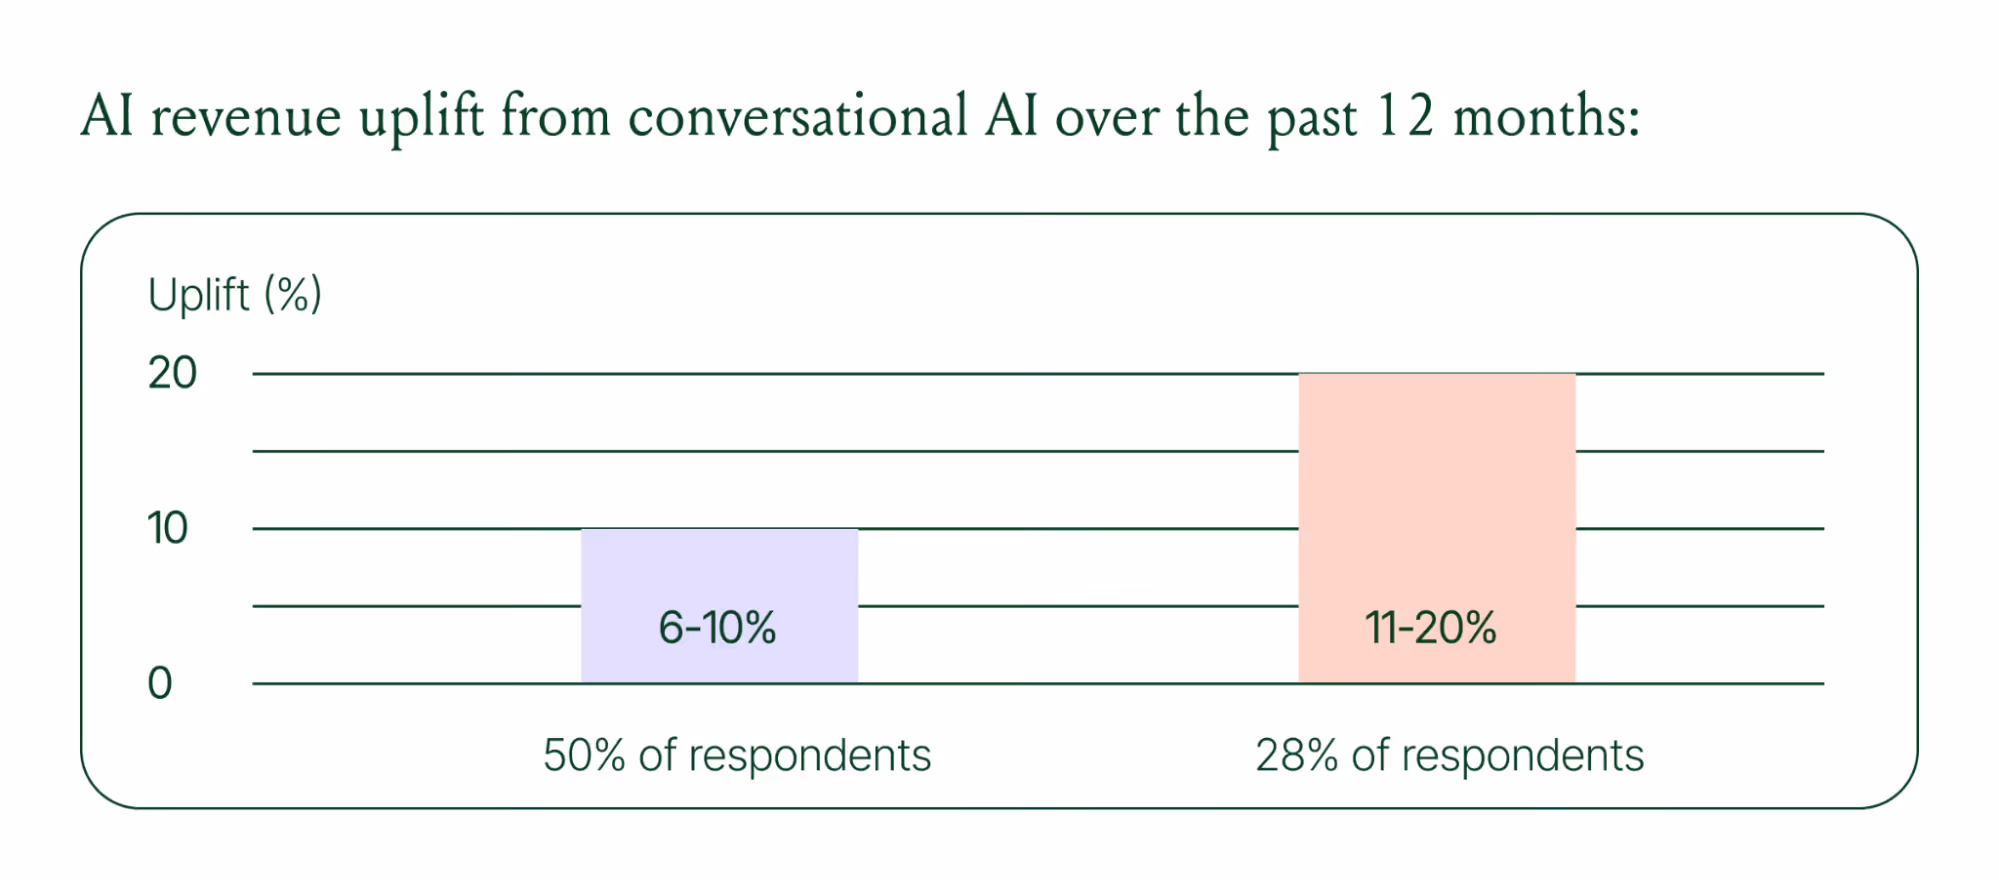
- AI-only influenced orders grew 63% in a single year, from 2.7 million in Q1 to 4.4 million in Q4.
- Brands treating conversation as a revenue channel. They’re not just a support function, generating higher AOV, shorter buying cycles, and stronger retention.
The page-based shopping experience dominated for decades. Customers would search, browse, compare, abandon, get retargeted, return, and eventually buy (sometimes).
That journey is no longer the only option.
Shoppers are turning to chat, messaging, and AI-powered tools to find what they need. Instead of clicking through product pages or reading static FAQs, they ask questions, have back-and-forth conversations, and get answers that move them closer to a purchase in real time. The path to checkout has changed, and the brands that recognize this are pulling ahead.
Read our 2026 State of Conversational Commerce Report to learn more about conversation commerce trends from 400 ecommerce decision-makers and 16,000+ ecommerce brands using Gorgias.
{{lead-magnet-1}}
The shopping journey has collapsed into a single thread
The traditional shopping journey was a solo experience. A shopper had a need, searched for options, browsed across sessions, and eventually made a decision — often days later, after being retargeted multiple times. Support only entered the picture after the purchase.
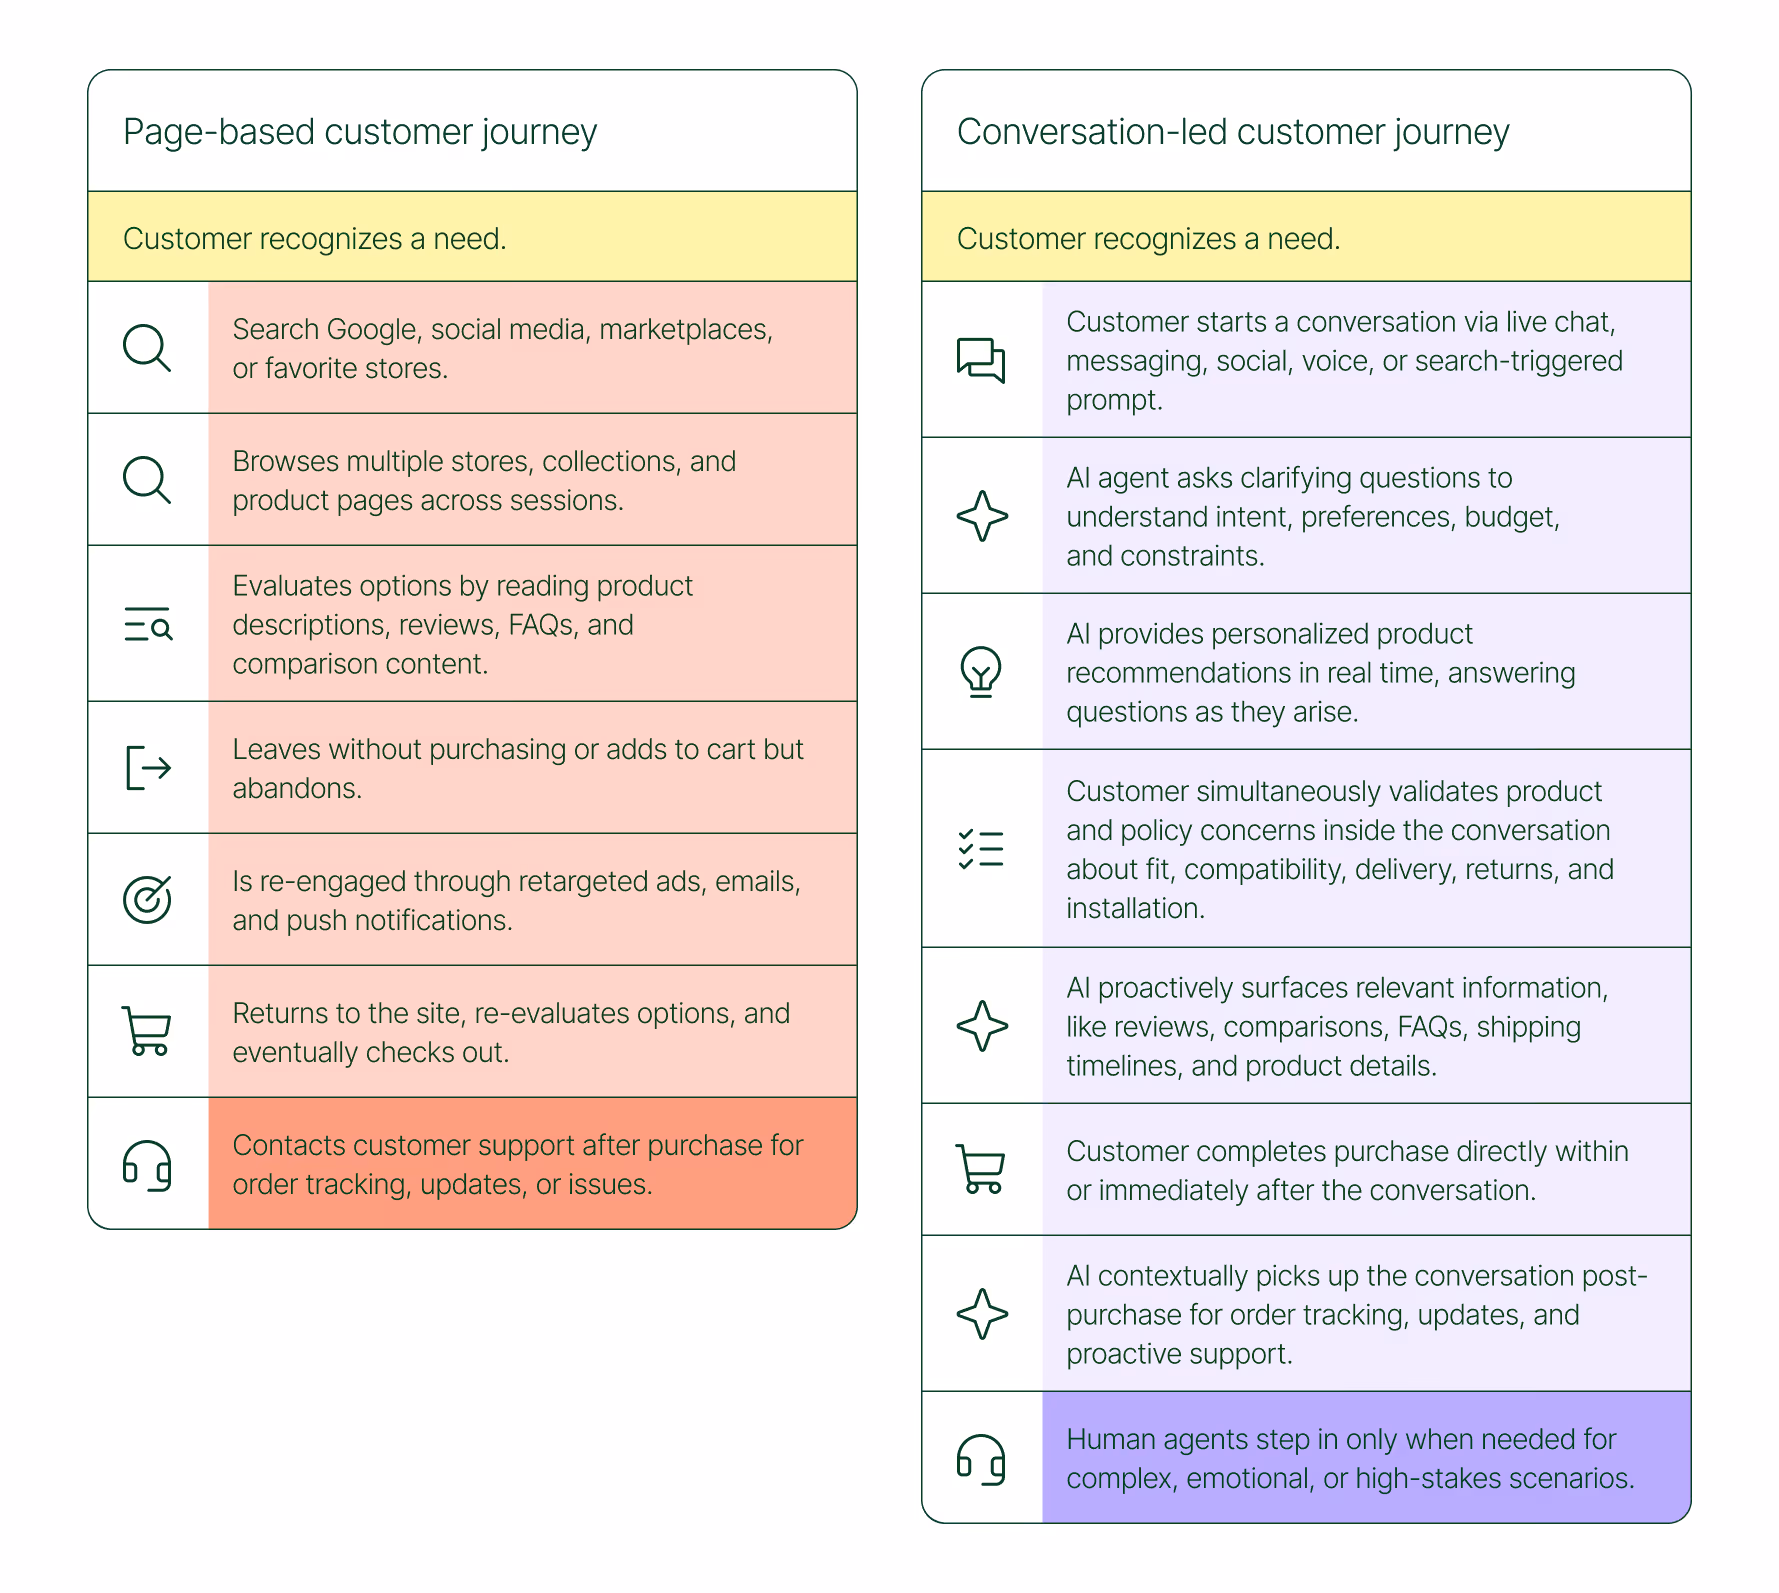
The conversation-led journey collapses that timeline:
- A shopper recognizes a need and starts a conversation via chat, messaging, or a search-triggered prompt
- An AI agent asks clarifying questions about preferences, budget, and constraints
- The AI provides personalized product recommendations in real time
- The shopper validates concerns about fit, compatibility, delivery, and returns, all inside the conversation
- The shopper completes the purchase directly within or immediately after that exchange
- The AI picks up the conversation post-purchase for order tracking and proactive support
- A human agent steps in only when the situation calls for it
What used to take days now takes minutes. Discovery, evaluation, and purchase happen in a single thread.
Conversation is a revenue strategy, not a support upgrade
79% of brands agree that AI-driven conversational commerce has increased sales and purchase rates in their business. When brands were asked to rank the highest-return areas:
- 38% cited improved customer support efficiency
- 23% pointed to higher customer retention and loyalty
- 20% saw improved purchase rates
Those numbers reflect something important: the value of conversation compounds. Faster support reduces friction. Better retention raises lifetime value. More confident shoppers buy more often and spend more per order.
The brands seeing the biggest returns aren't just using AI to deflect tickets. They're using it to create one-to-one shopping experiences at scale.
What the data shows about AI-influenced orders
Looking at AI-only influenced orders across key verticals like Apparel and Accessories, Food and Beverages, Health and Beauty, Home and Garden, and Sporting Goods, the growth across a single year was significant.
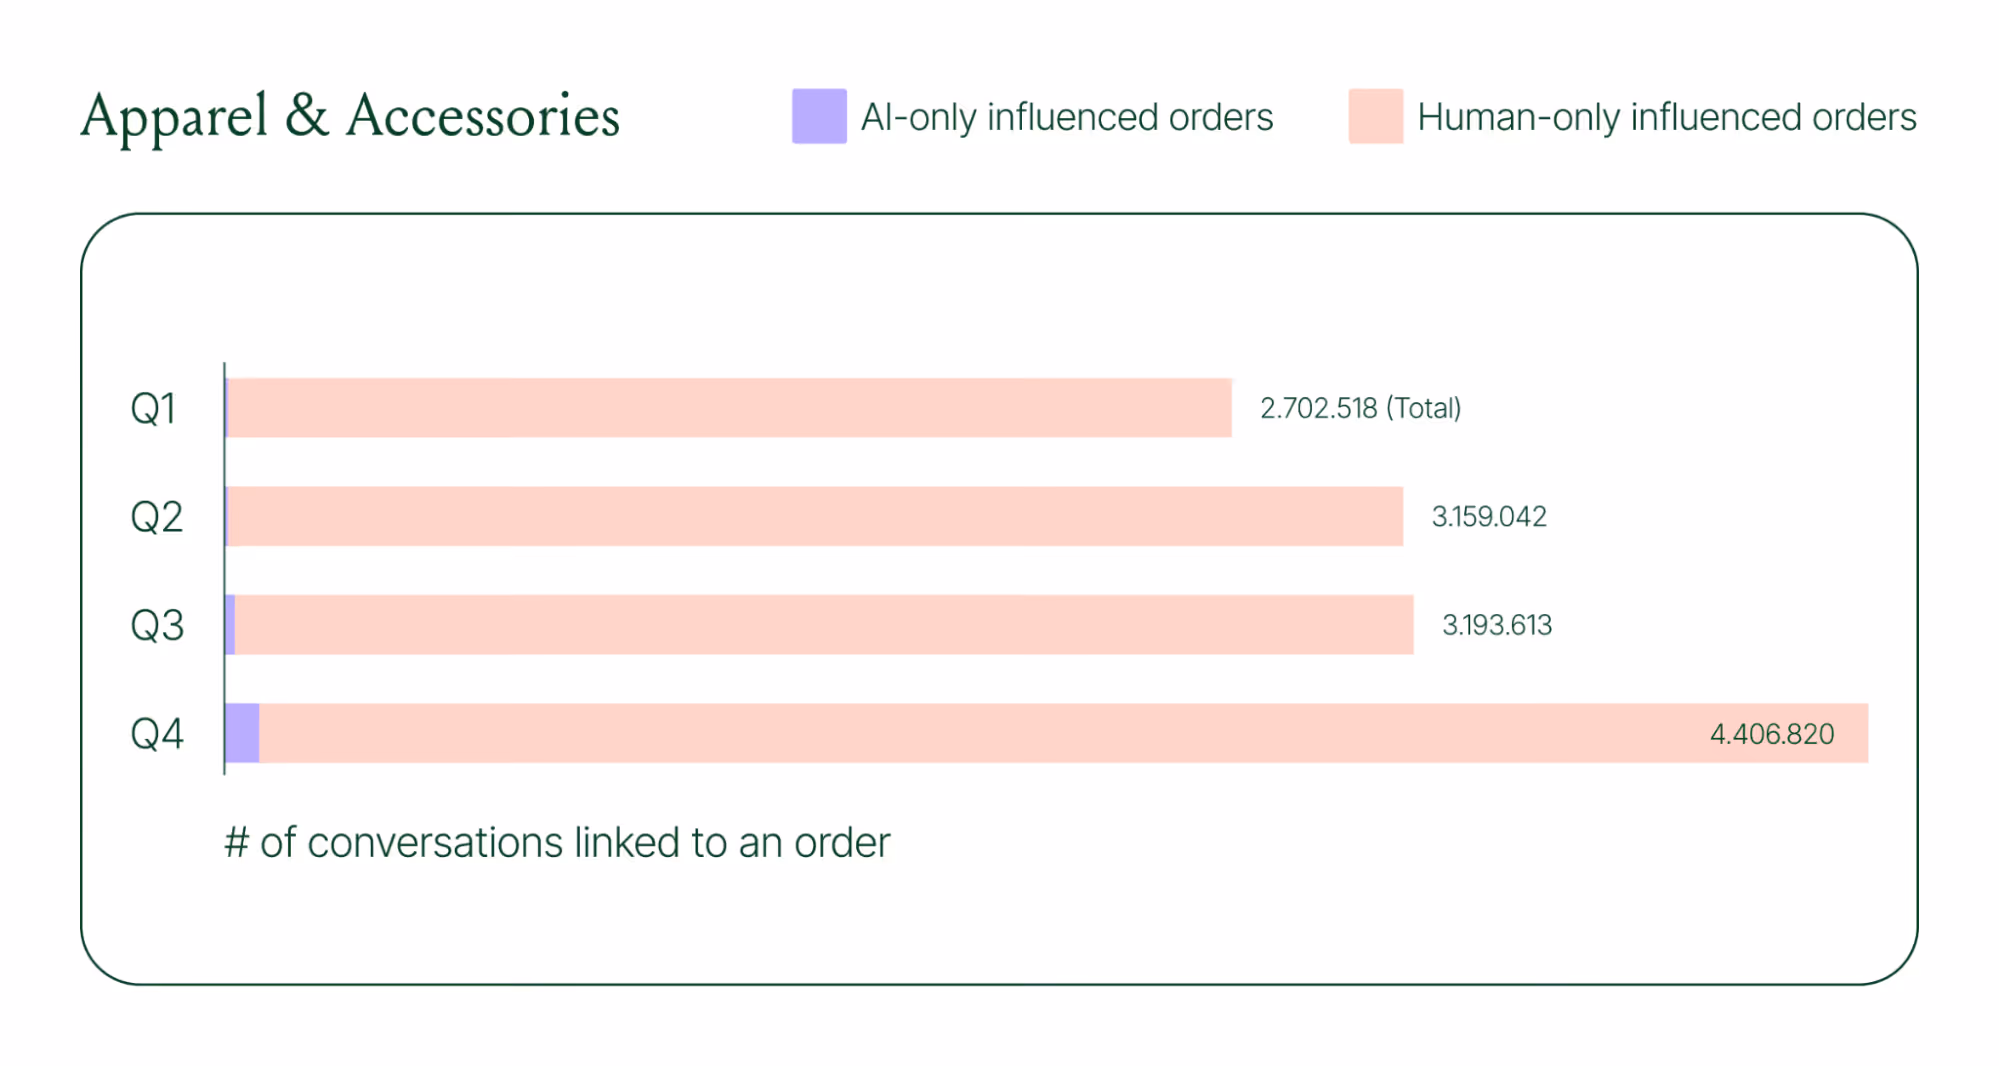
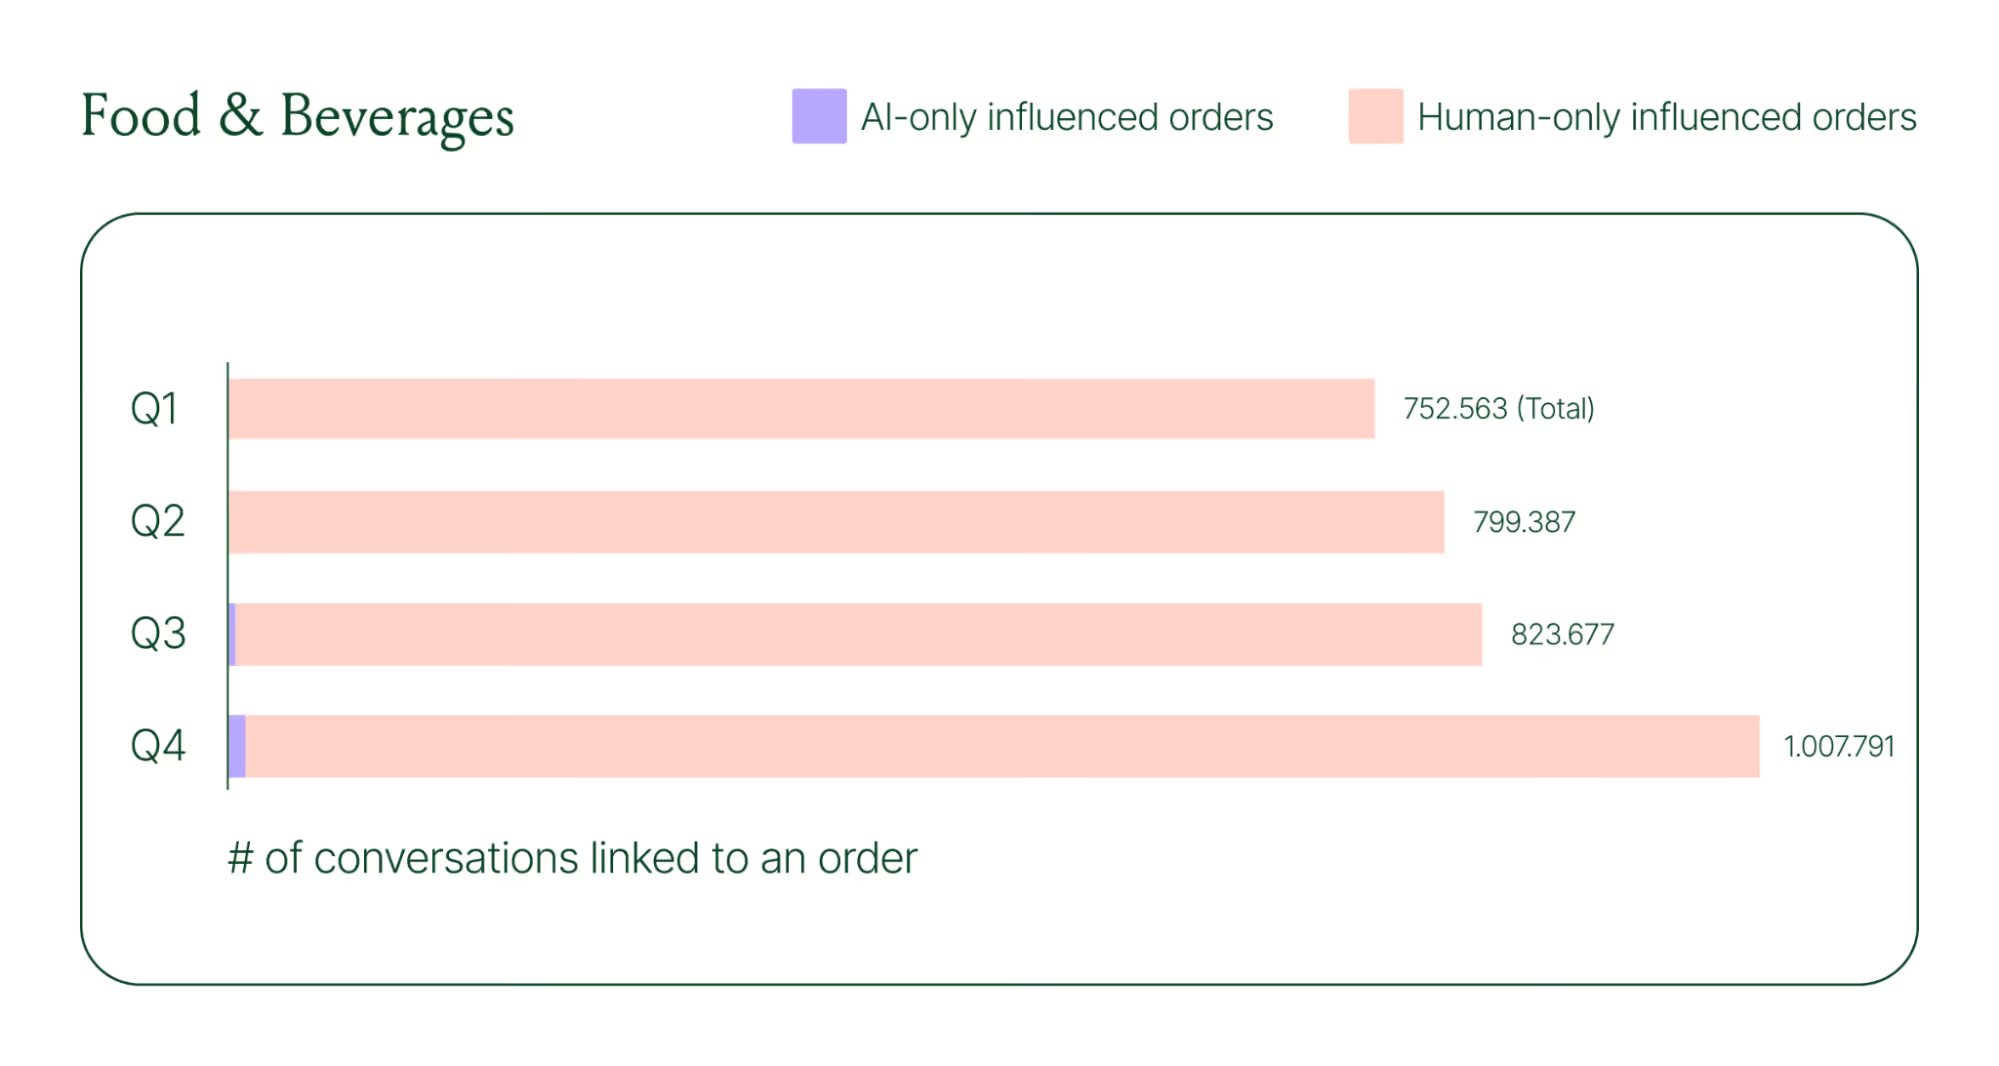
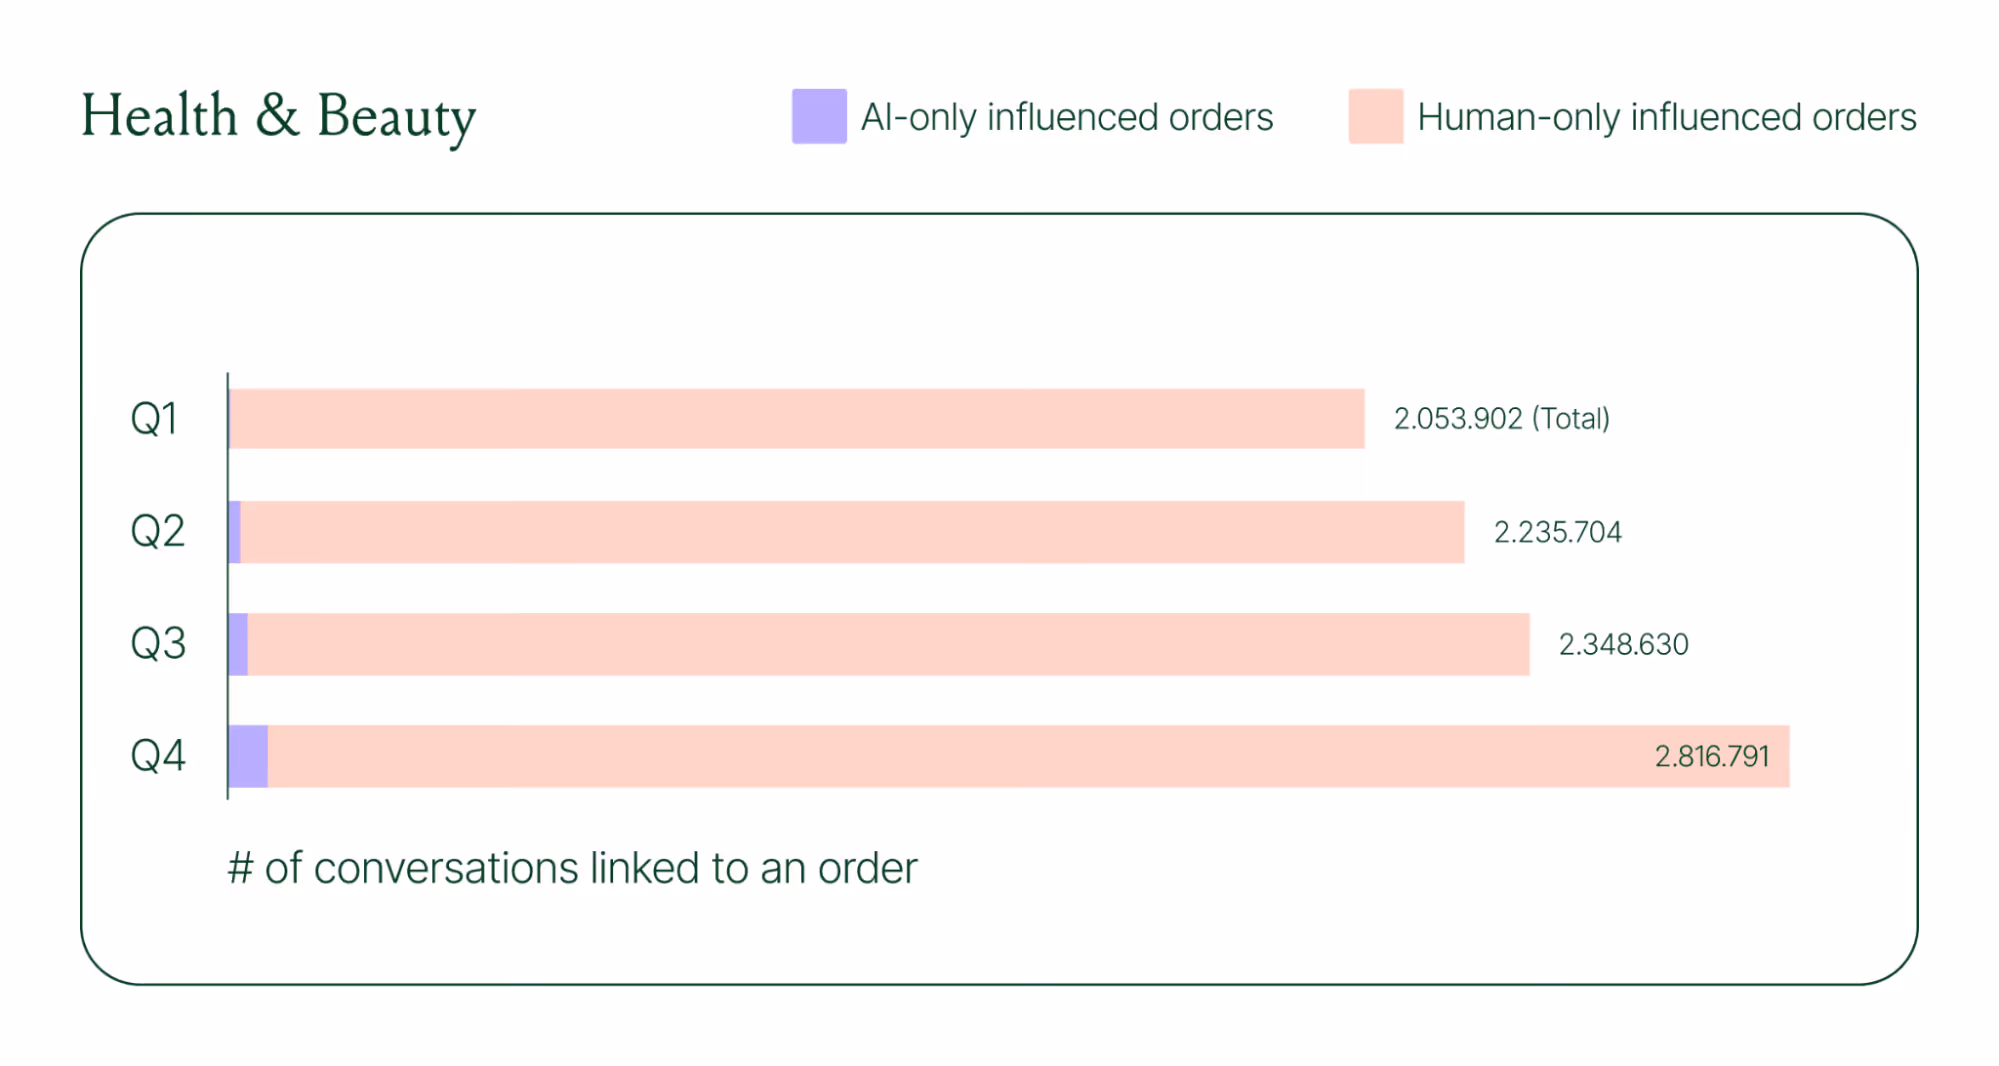
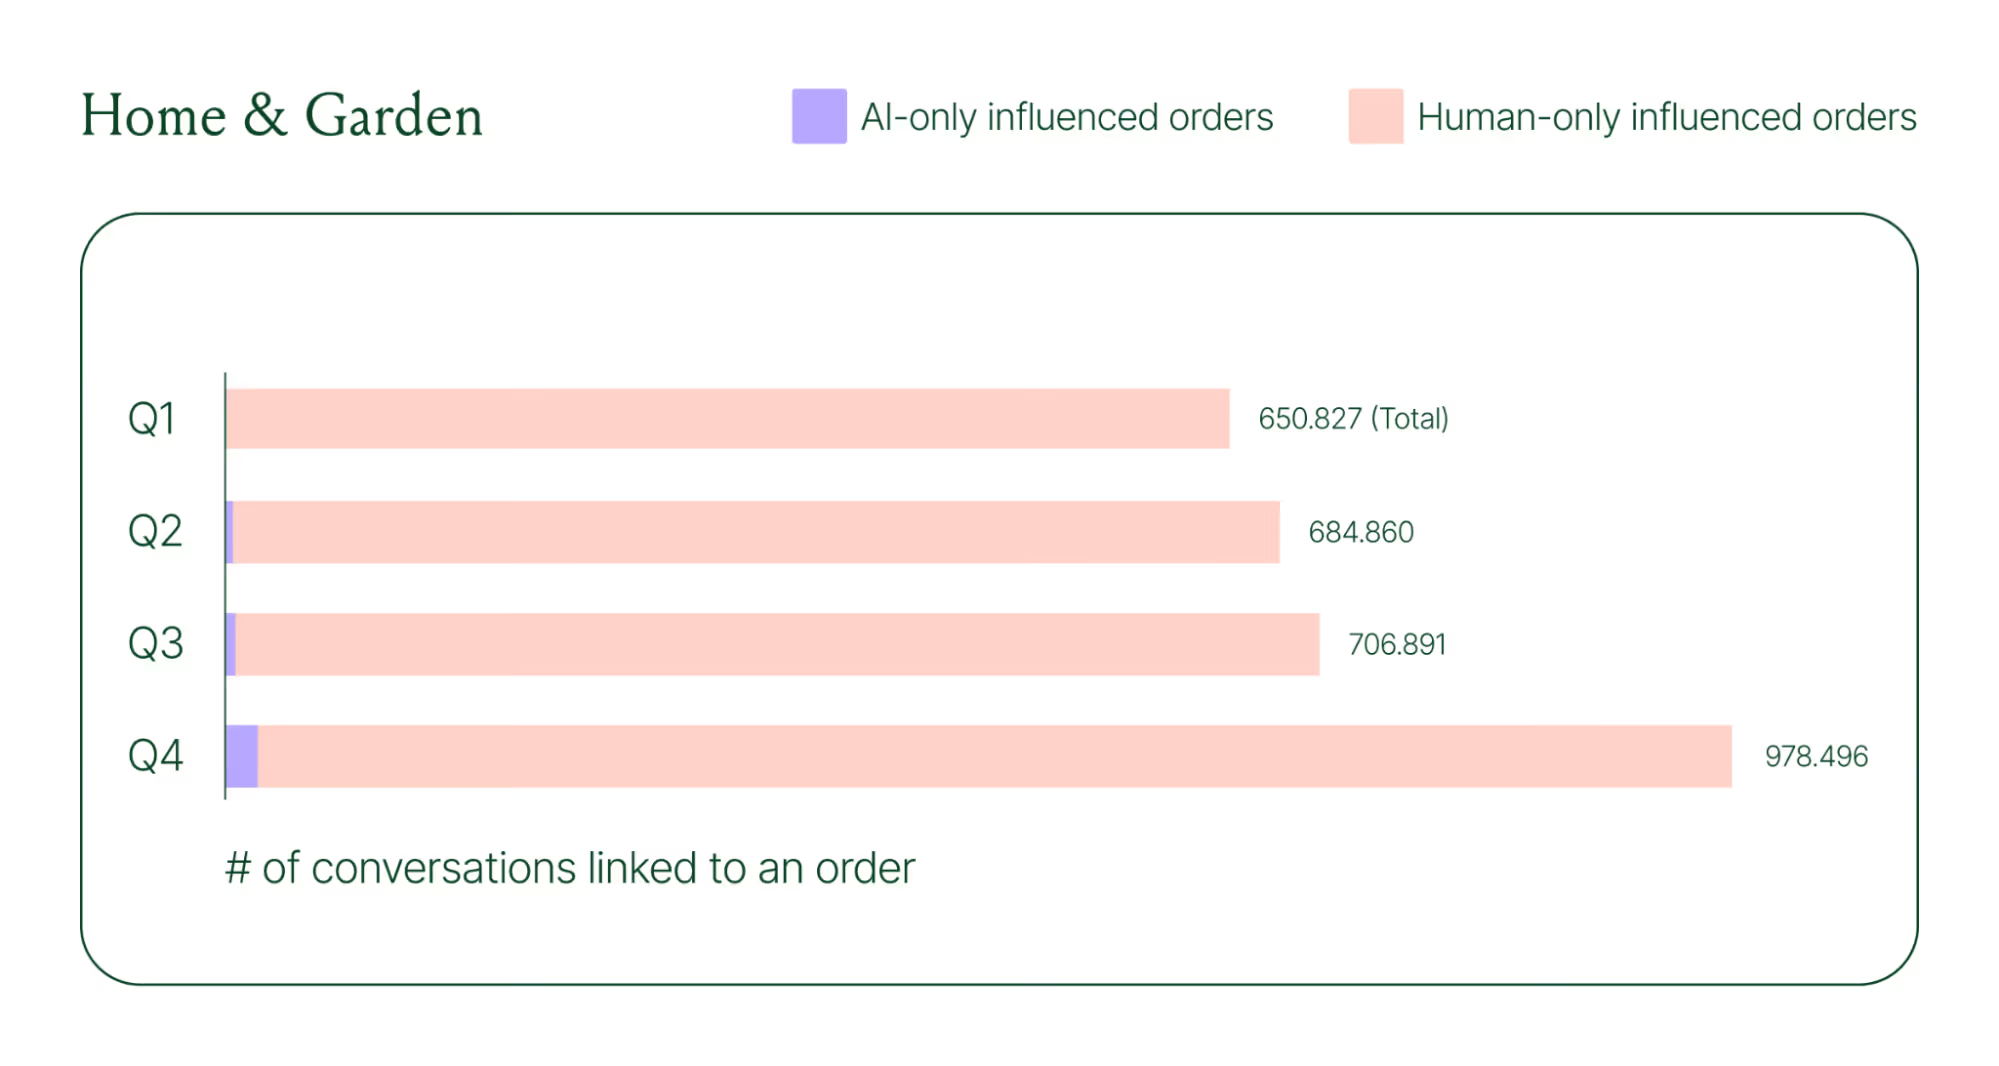
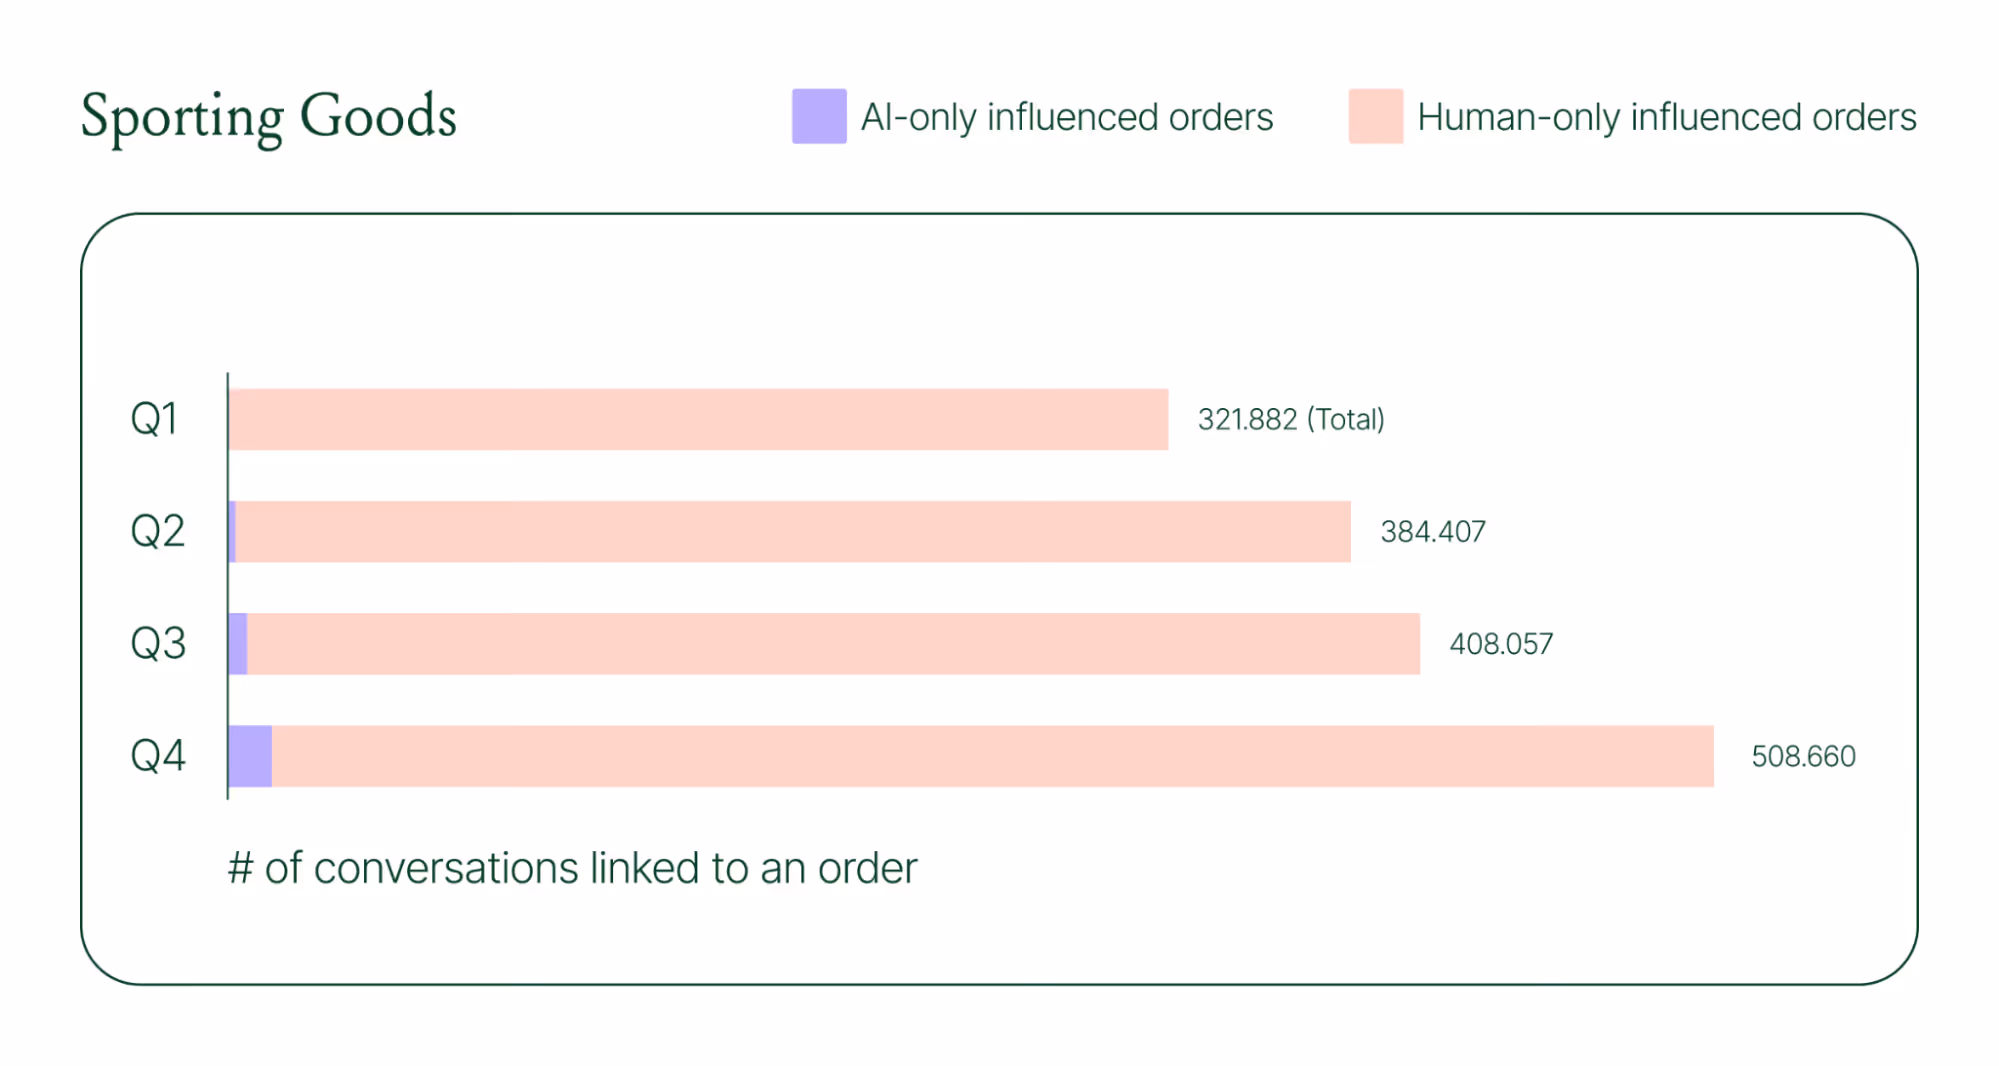
Across industries, ecommerce brands saw AI step into conversations, reduce shopper hesitation, and drive higher QoQ conversion rates.
Learn more about AI-powered revenue generation in the full 2026 Conversational Commerce Report.
Why brands are making this a strategic priority
84% of brands say the strategic importance of conversational commerce is higher than it was a year ago. 82% agree it will be mainstream in their sector within two years.
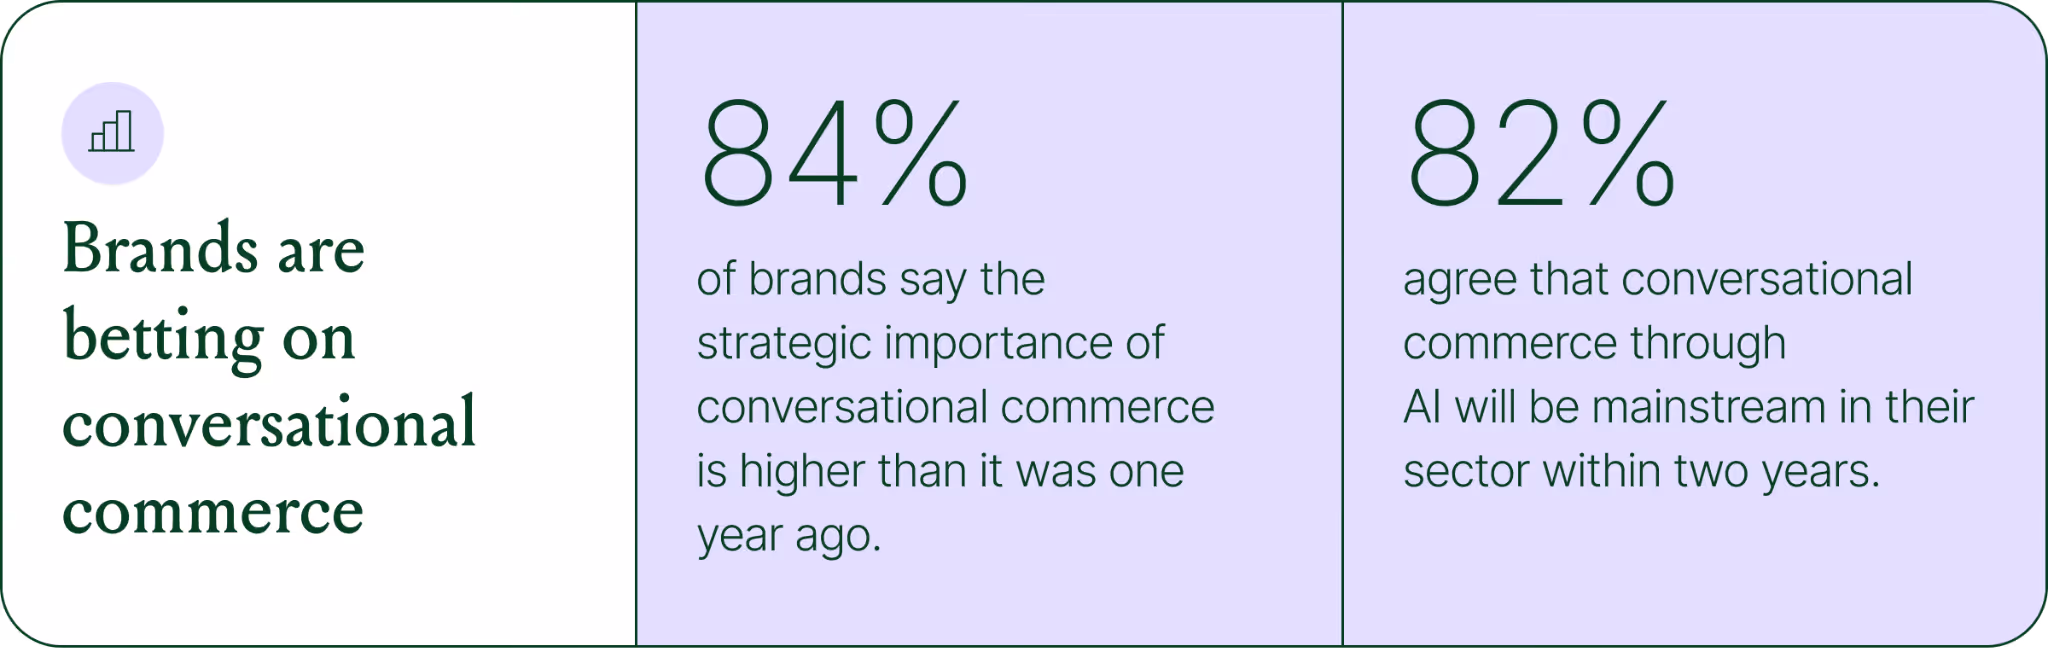
That shift is registering at the leadership level because of what conversational commerce does to the buying experience. Creating one-to-one touchpoints earlier in the journey drives higher AOV, shorter buying cycles, and stronger purchase rates. Shoppers who get real-time answers to their questions are more confident.
What this looks like in practice: TUSHY
TUSHY, known for eco-friendly bidets and bathroom essentials, is a useful example of what happens when you take conversational commerce seriously.
Bidets aren't an impulse purchase. Shoppers have real questions about fit, compatibility, and installation. Those questions used to go unanswered until the CX team could respond, often after the customer had abandoned the cart.
TUSHY used Gorgias's AI Agent and shopping assistant capabilities to automate pre-sales support. AI Agent engaged shoppers in real-time conversations, addressed their concerns directly, and built confidence at the moment of highest intent.
This resulted in a 190% increase in chat-based purchases, a 13x return on investment, and twice the purchase rate of human agents.
How to apply this to your strategy
You don't need to overhaul your entire operation to start seeing results. The most effective approach is to start where the impact is clearest and expand from there.
A few places to begin:
- Pre-sales chat. Identify your most common pre-purchase questions (sizing, compatibility, shipping timelines) and ensure your AI can answer them confidently and promptly.
- Product page engagement. Use proactive chat prompts triggered by page behavior to start conversations before shoppers leave.
- Post-purchase follow-up. Let AI pick up the conversation after checkout with order updates and proactive support, reducing inbound volume and building trust.
- Human escalation. Define clearly which situations require a human agent – complex issues, emotional exchanges, high-stakes decisions.
Want to see the full picture of where conversational commerce is headed in 2026? Read the full report to explore the data, trends, and strategies shaping the next era of ecommerce.
{{lead-magnet-1}}

AI Is Table Stakes for Ecommerce: What the Data Tells Us About 2026
TL;DR:
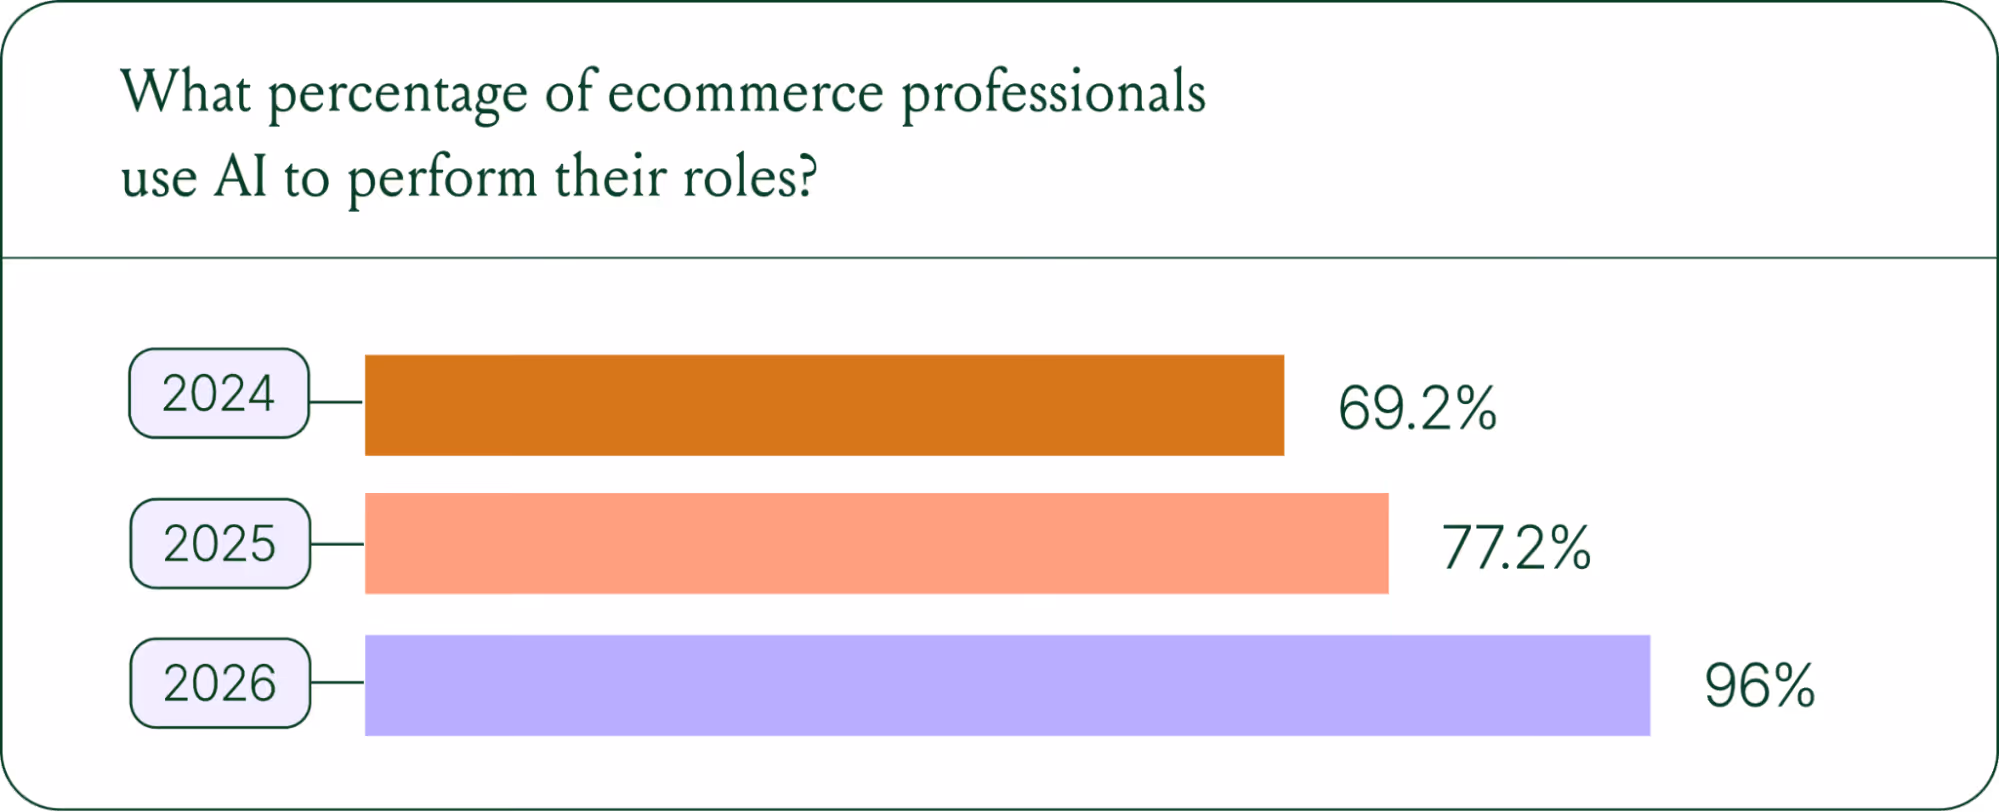
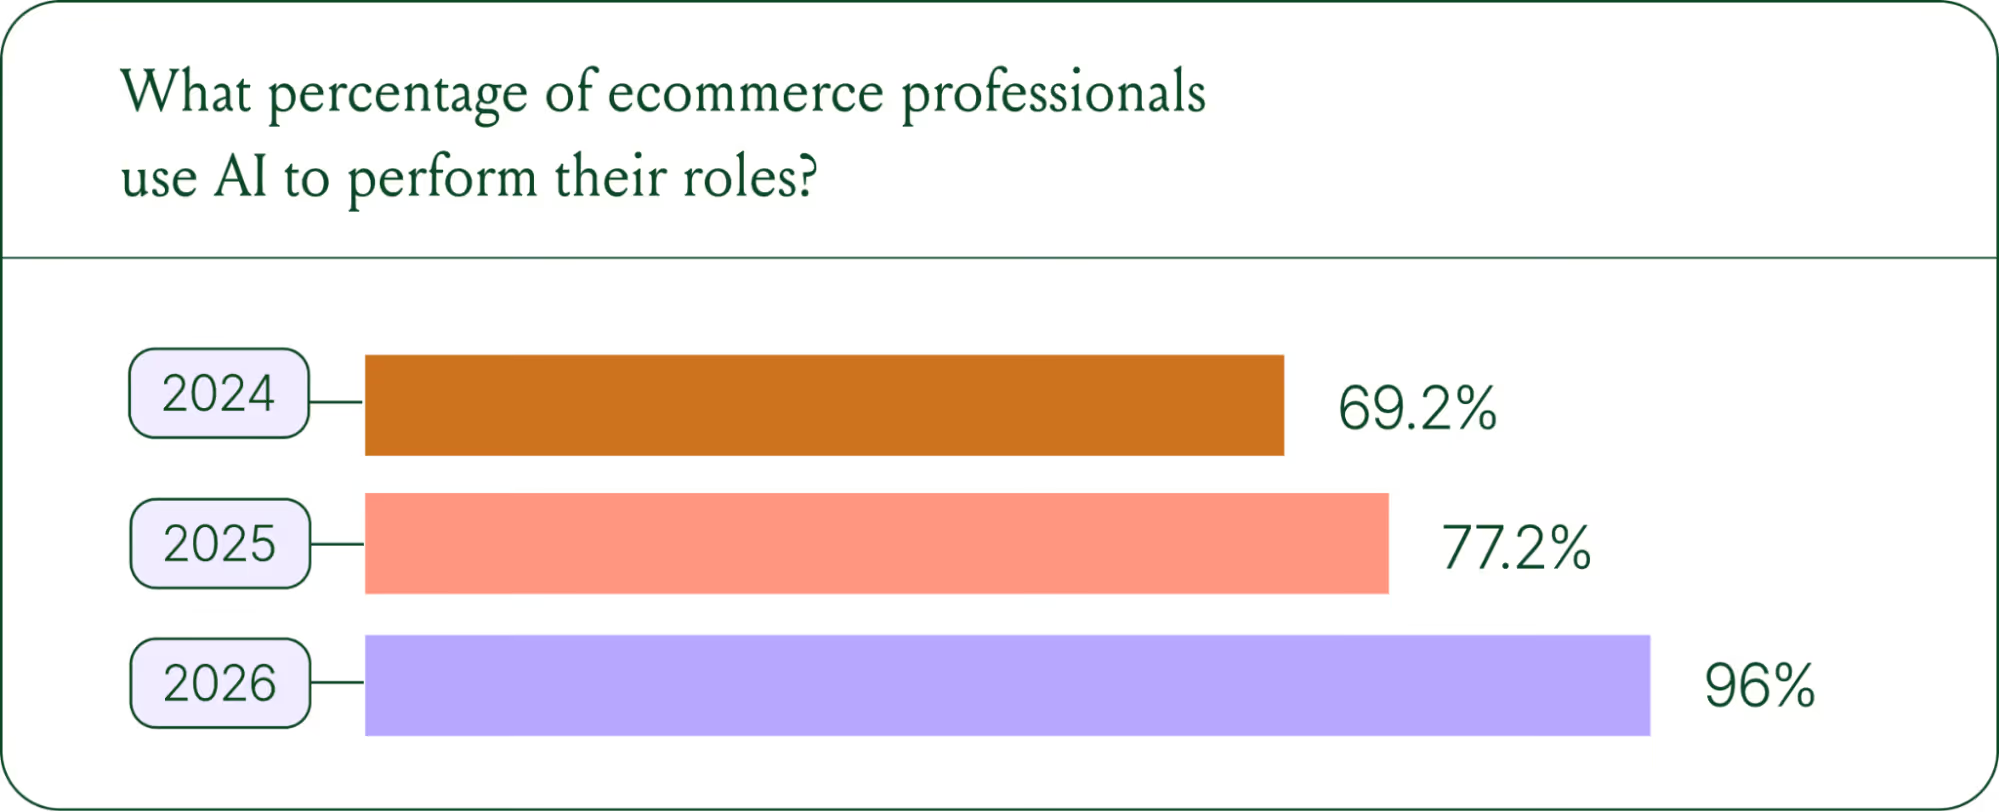
- AI adoption is rapidly accelerating. 96% of ecommerce professionals now use AI in their roles, up from 69% in 2024.
- AI has moved beyond support automation. Use cases have evolved into revenue generation, personalization, and logistics.
- Brands are tying AI success to profit-and-loss outcomes. 60% of brands consider AOV a top indicator of AI effectiveness.
A year ago, ecommerce brands were still debating whether AI was worth the investment. That debate is over. Today, nearly every ecommerce professional uses AI to do their job.
The shift isn't just about adoption. It's about what AI is used for and how brands measure its impact. Support automation was the entry point. Now, AI is embedded across the full operation, from product recommendations to inventory control to real-time shopping conversations.
In our 2026 State of Conversational Commerce Report, we break down trends on AI usage among 400 ecommerce decision-makers and 16,000+ ecommerce brands using Gorgias.
{{lead-magnet-1}}
AI adoption has reached a tipping point
If we rewind 12 months ago, the industry was still split on AI. Some ecommerce professionals were excited, but most were still hesitant. In 2024, 69% of ecommerce professionals used AI in their roles. By 2025, that number reached 77%. In 2026, it hit 96%.
The confidence numbers back it up. 71% of brands say they are confident using AI for ecommerce, and 73% are satisfied with its business impact.
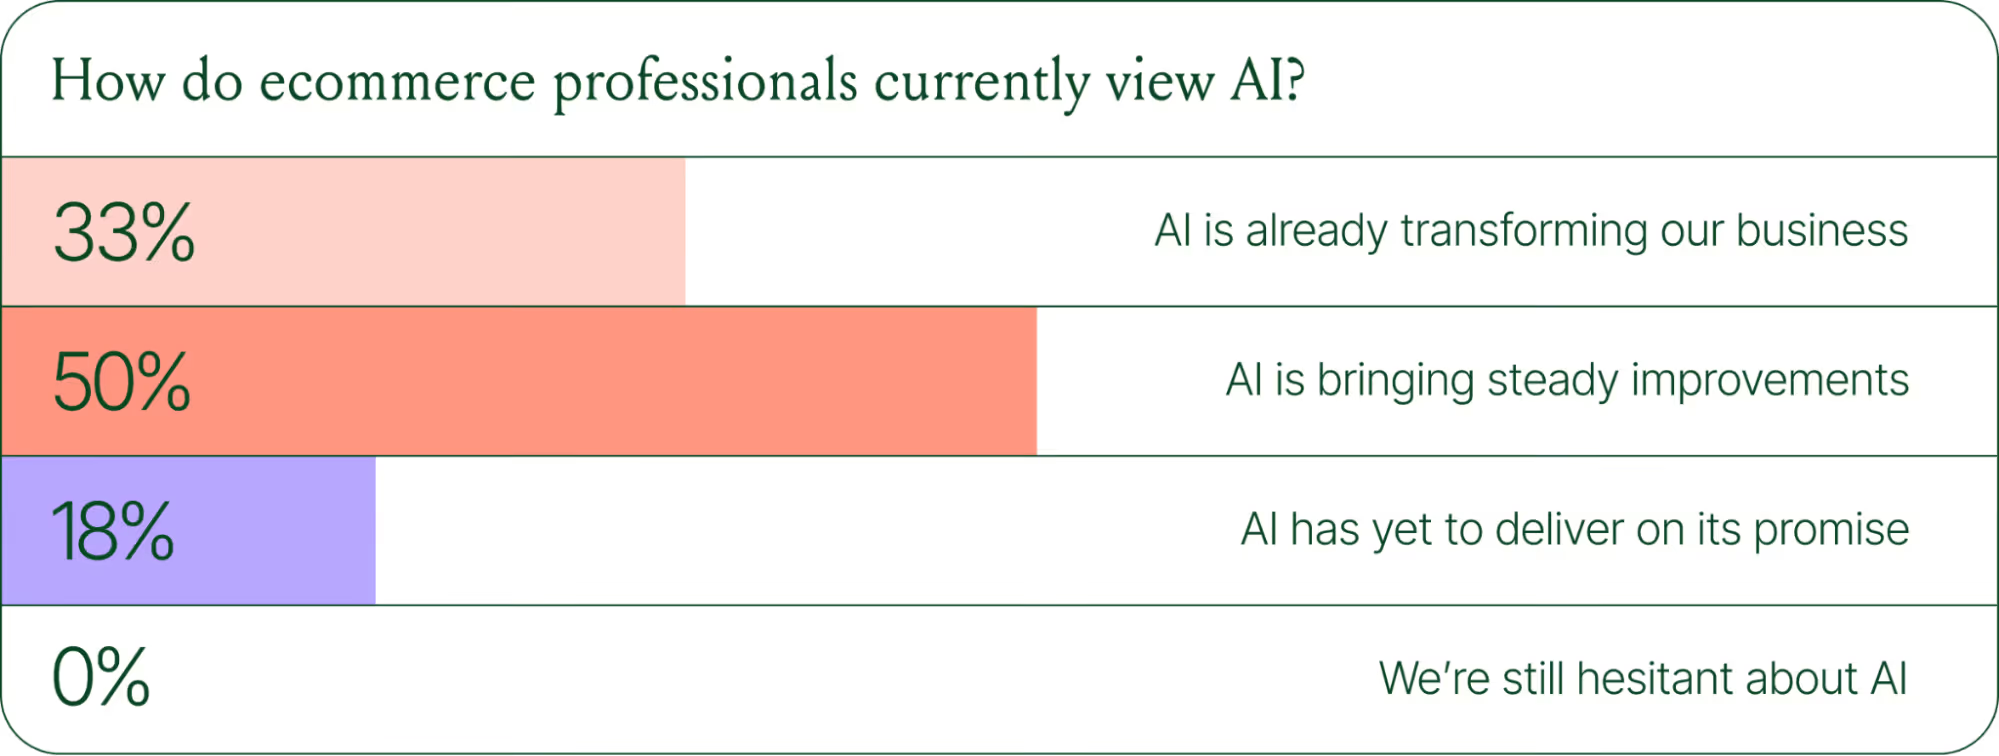
In early 2025, only 30% of ecommerce professionals rated their excitement for AI at 10/10. Today, zero percent of respondents describe themselves as hesitant about AI.
AI use cases now span the full ecommerce stack
Using AI in ecommerce is not new. In fact, it dates back to the 1980s with the invention of algorithms and expert systems. And if you’ve ever leveraged similar product recommendations or chatbots, you’ve already integrated AI into your ecommerce stack.
Modern AI is far more sophisticated.
With the rise of agentic commerce and conversational AI, brands began leveraging AI agents to automate the processing of repetitive support tickets. That’s still happening today, but the scope has expanded beyond the support queue.
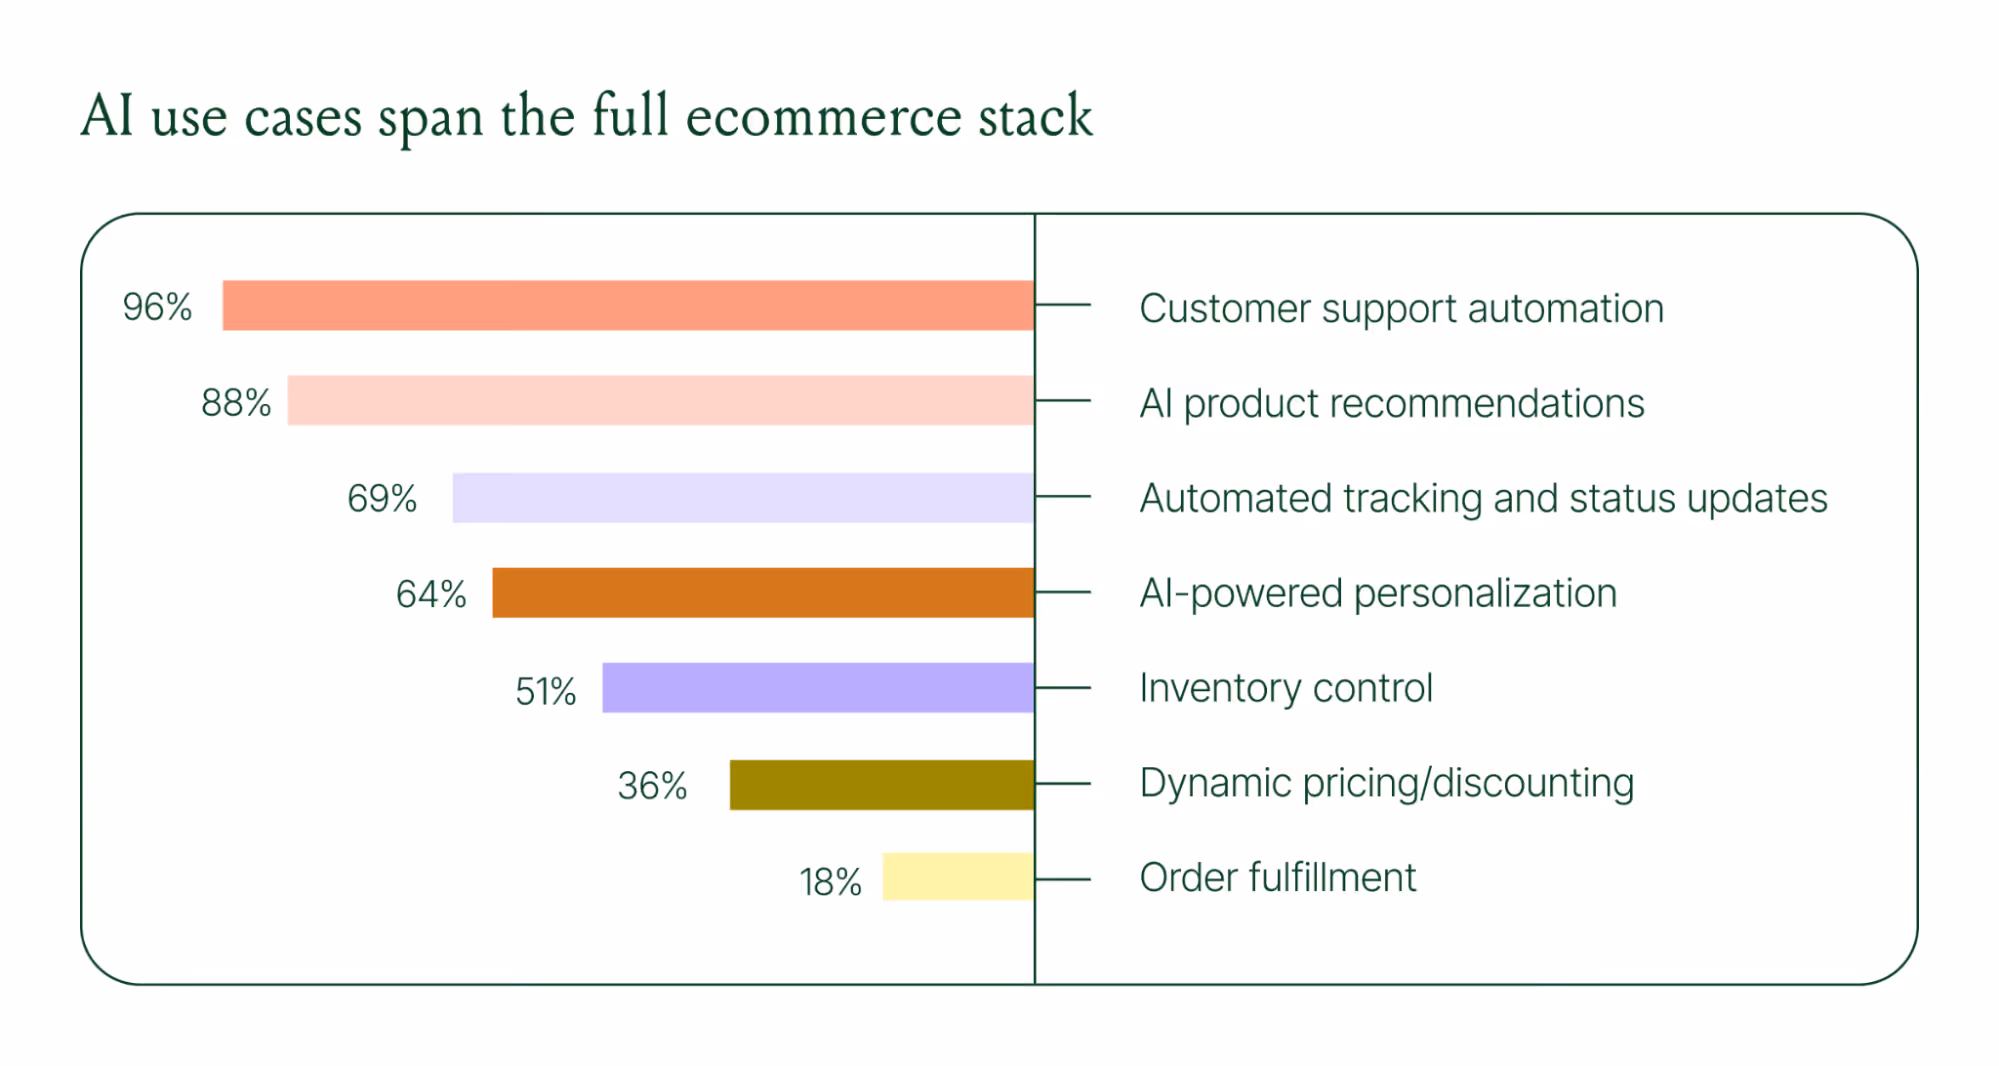
Ecommerce brands are deploying AI across every layer of their operation:
- Customer support automation: 96%
- Product recommendations: 88%
- Automated tracking and status updates: 69%
- Personalization: 64%
- Inventory control: 51%
- Dynamic pricing and discounting: 36%
- Order fulfillment: 18%
When brands were asked which channels contribute most to their AI success, conversational channels dominated. Social media messaging led at 78%, followed by SMS at 70%, and website live chat at 51%. Shoppers want fast, personal conversations, and AI is the best way to deliver that at scale.
Learn more about AI adoption, perception, and use case trends in the full 2026 Conversational Commerce Report.
How AI is changing CX success metrics
For decades, customer support success meant fast response times and high satisfaction scores. Those are still important indicators of success, but leading brands are adding revenue-focused metrics to their dashboards.
91% of brands still track CSAT as a measure of AI's impact. But 60% now include AOV as a top indicator, and higher-revenue brands earning $20M+ are focusing on metrics like total operating expenses, cost per resolution, incremental revenue, and one-touch ticket rate.
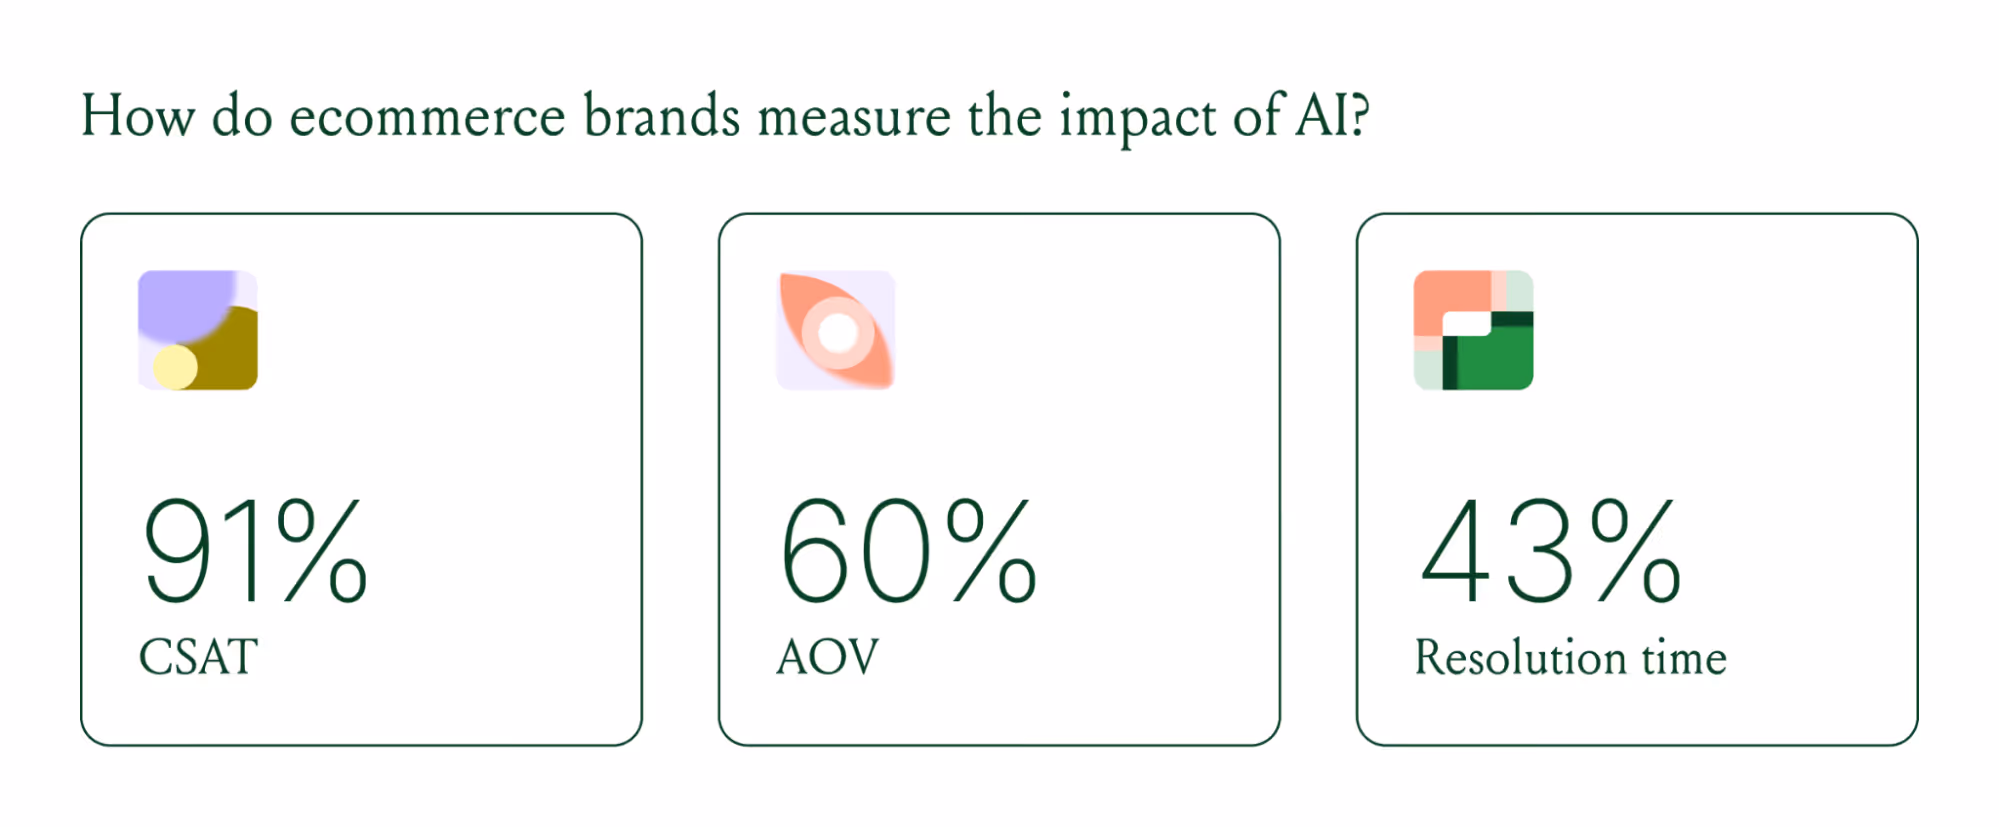
AI can now start a conversation, ease customer doubts, sell, upsell, and recover abandoned carts in a single conversation. When you’re only measuring CSAT, you’re ignoring the real ROI of conversational AI investment.
AI makes every conversational channel a storefront
Virtual shopping assistants now proactively engage shoppers, adapt to their needs in real time, and offer contextual product recommendations and upsells. When the moment calls for it, they can close the deal with a targeted discount.
Gorgias brands using AI Agent's shopping assistant capabilities nearly doubled their purchase rates and converted 20–50% better than those using AI Agent for support only.
Orthofeet, the largest provider of orthopedic footwear in the US, is a concrete example of this in practice. Using Gorgias, they achieved:
- 56% of support tickets automated in 2 months
- Email response times down from 24 hours to 35 seconds
- Double-digit revenue growth without adding headcount.
What this means for your AI strategy
The data tells a clear story: AI has evolved beyond a tool for handling tier 1 support tickets. It’s a core part of your revenue generation strategy.
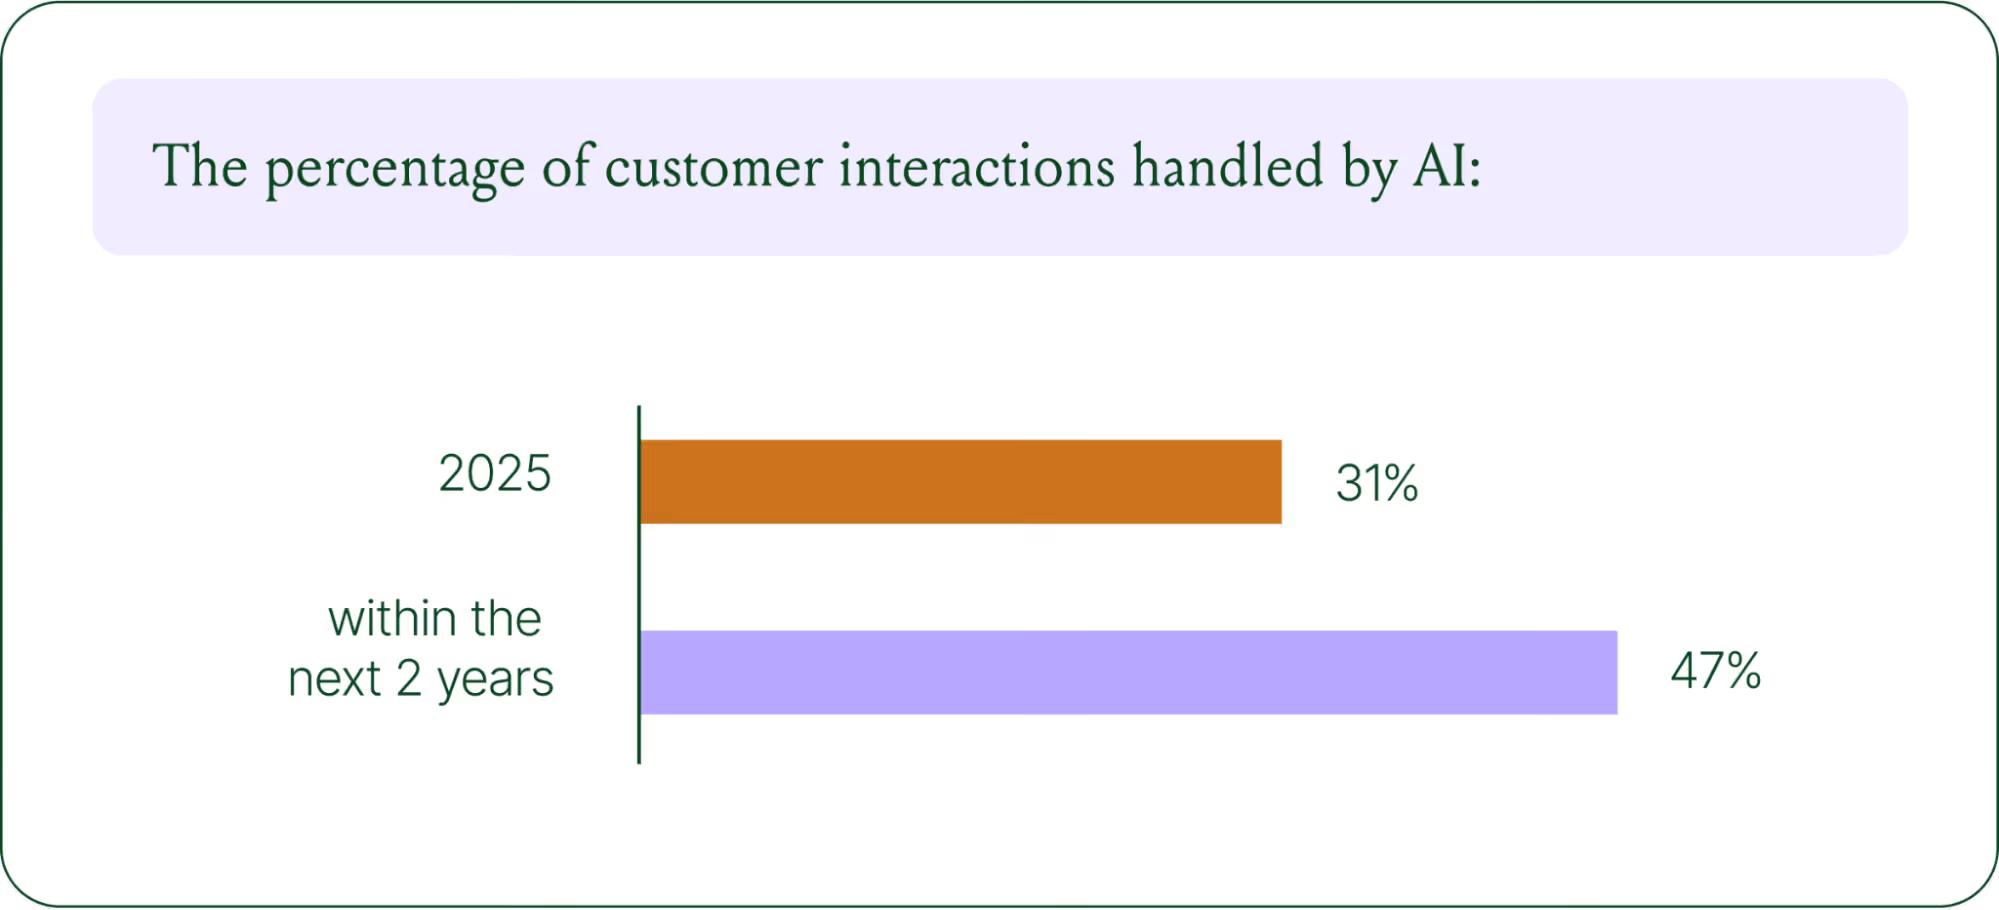
57% of brands are already using AI for 26–50% of all customer interactions, and 37% expect that share to rise to 51–75% within the next two years. The brands building toward that range now are the ones who will have the operational advantage when it matters most.
The practical question isn't whether to invest in AI. It's where to focus first. Based on where brands are seeing the most impact, three priorities stand out:
- Start with high-volume, low-complexity tickets. WISMO (where is my order) inquiries, return policy questions, and order status updates are where AI delivers the fastest return. Automate these first.
- Expand into conversational channels. Social messaging and SMS are where AI is driving the most success right now.
- Connect AI performance to revenue metrics. If you're only measuring CSAT and response time, you're missing half the story. Add AOV, conversion rate, and incremental revenue to your reporting.
Want to go deeper on the full 2026 conversational commerce trends? Read the complete report for data across every major AI use case in ecommerce.
{{lead-magnet-1}}

The State of Conversational Commerce: 5 Trends Reshaping Ecommerce in 2026
TL;DR:
- AI is resolving tickets, not just replying. AI now handles 31% of customer interactions for ecommerce brands, and that number is expected to nearly double within two years.
- Every channel is becoming a storefront. Conversations are replacing the traditional browse-and-buy journey, with 79% of brands reporting sales from AI-driven interactions.
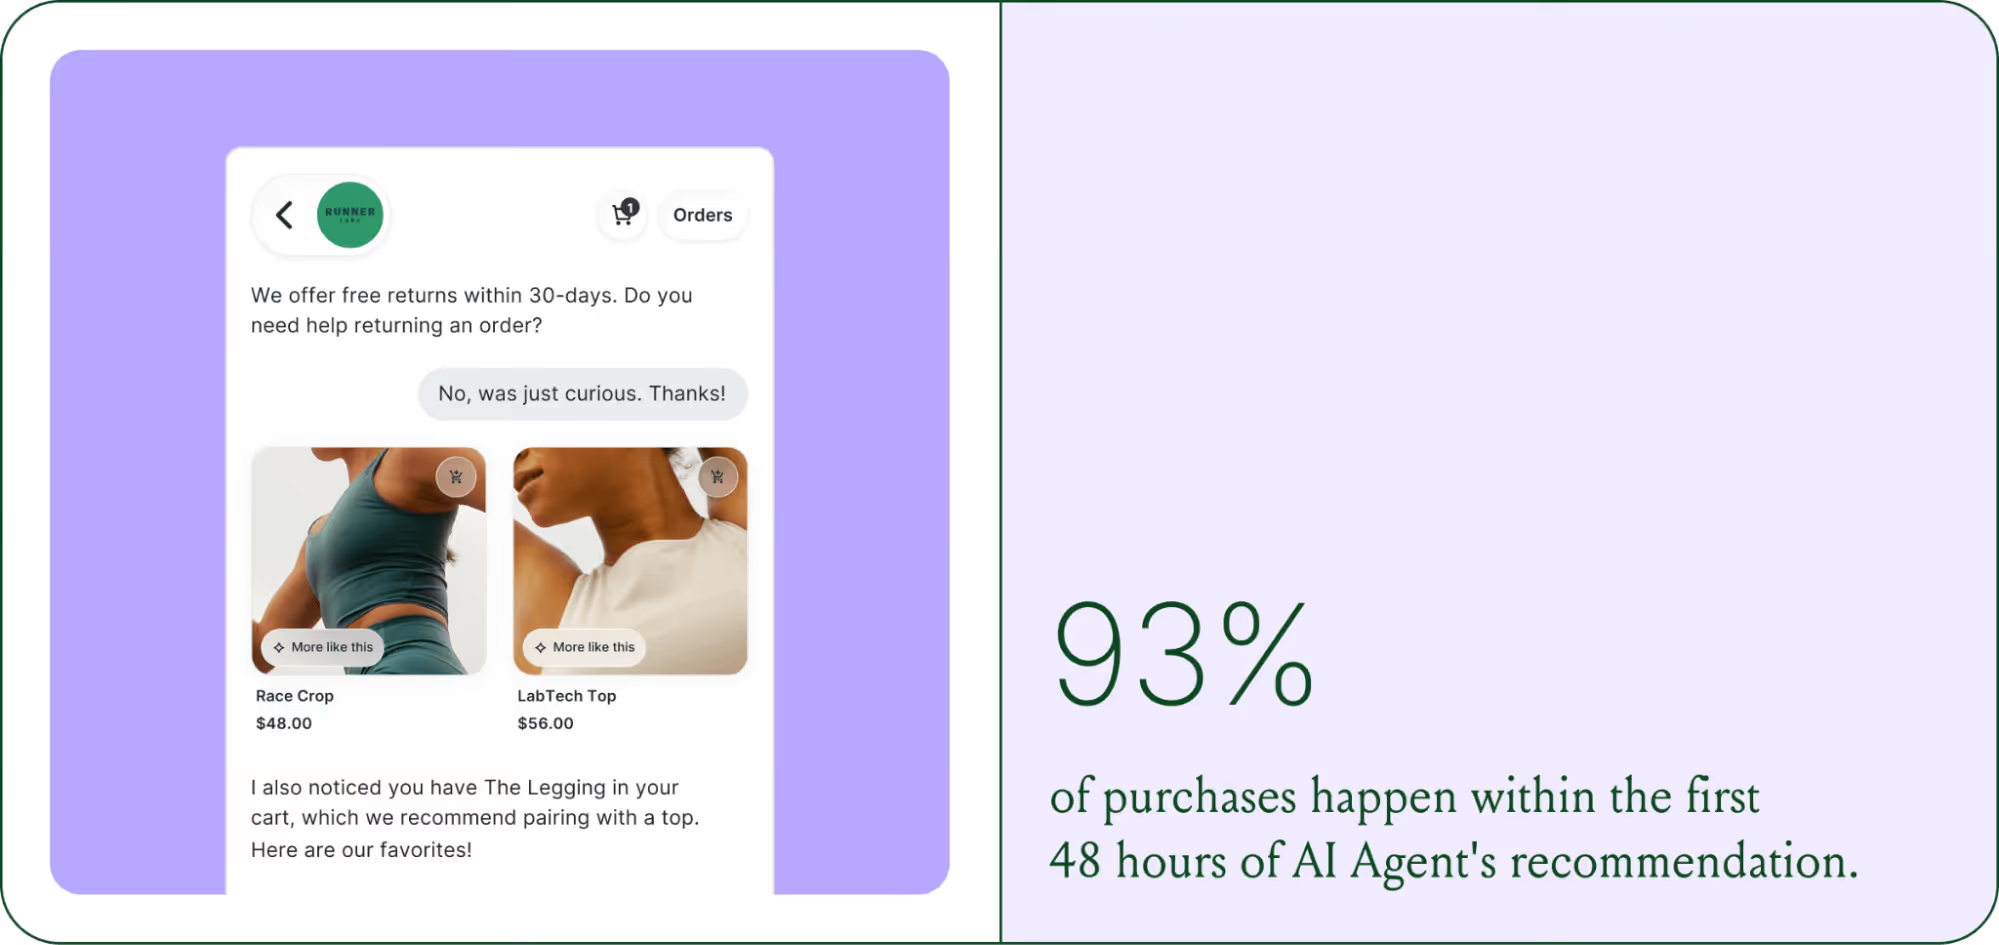
- AI is shortening the buying cycle. 93% of AI-influenced purchases happen within the first 48 hours of the conversation.
- CX teams are changing, not shrinking. Ecommerce brands are actively hiring for more technical roles to implement, coach, and maintain AI.
- The winning model is hybrid. AI handles volume and speed, while humans handle complexity and judgment.
The way shoppers buy online has shifted and customers are at the center.
They no longer want to scroll through product pages, dig through FAQs, or wait 24 hours for an email reply. They open a conversation, ask a specific question, and expect a useful answer in seconds. Brands that can’t deliver these experiences at scale are seeing customer hesitation turn into abandoned carts and lost revenue.
This shift has a name: conversational commerce. It's the practice of using real-time, two-way conversations as your primary sales channel, through chat, AI agents, messaging apps, and voice.
What started as an experiment for early adopters has become a key growth lever, with 84% of ecommerce brands treating conversational commerce as a strategic pillar this year vs. last year.
We surveyed 400 ecommerce decision-makers across North America, the U.K., and Europe to understand how conversational commerce and AI are reshaping the ecommerce landscape. These findings are complemented by aggregated and anonymized internal Gorgias platform data from 16,000+ ecommerce brands.
The State of Conversational Commerce in 2026 trends report breaks down all of the findings, including five key trends shaping the ecommerce landscape.
{{lead-magnet-1}}
Trend 1: AI is table stakes for ecommerce and it’s no longer just about efficiency
A few years ago, adding an AI chatbot to your site that could provide tracking links and Help Center article recommendations was a differentiator. Today, it's table stakes. McKinsey found that 71% of shoppers expect personalized experiences, and 76% get frustrated when they don't get them.
Right now, most ecommerce professionals use AI, with 93% having used it for at least 1 year. Enthusiasm is accelerating quickly, with only 30% of ecommerce professionals rating their excitement for AI at 10/10 in April 2025. Similarly, while AI adoption rose steadily year over year, it reached a clear peak in 2026.
The use cases driving this adoption are practical and high-volume:
- Order tracking and status updates
- Returns, exchanges, and refund requests
- Shipping FAQs and delivery estimates

These are the tickets that flood brands’ inboxes every day. AI agents resolve them instantly, without pulling teams away from conversations that actually require human judgment.
Explore AI adoption and use case data in more depth in the full report.
Trend 2: Conversations are the new path to checkout
The traditional ecommerce funnel, visit site, browse products, add to cart, check out, is losing ground. Shoppers now discover products on Instagram, ask questions via direct message, and complete purchases without ever visiting a website.

Conversational AI is actively increasing revenue, with 79% of brands reporting that AI-driven interactions have increased sales and conversion in their business.
The practical implication is that every channel is becoming a storefront. Creating personalized touchpoints with customers earlier in the journey, through proactive engagement, is impacting the bottom line.
Read the full report to explore how AI conversions have increased QoQ by industry.
Trend 3: AI is accelerating the purchase cycle
Pre-purchase hesitation is one of the biggest conversion killers in ecommerce. A shopper lands on your product page, has a question about sizing or compatibility, can't find the answer quickly, and leaves. That's a lost sale that had nothing to do with your product.
Conversational AI changes that dynamic. When a shopper can ask a question and get an accurate, personalized answer in real time, the friction disappears.
Brands using Gorgias saw this play out at scale in 2025. When AI Agent recommended a product, 80% of the resulting purchases happened the same day, and 13% happened the next day.
Brands are further accelerating the buying cycle through proactive engagement. On-site features such as suggested product questions, recommendations triggered by search results, and “Ask Anything” input bars drove 50% of conversation-driven purchases during BFCM 2025.
Explore how AI is collapsing the purchase cycle in Trend 3 of the report.
Trend 4: AI is making CX teams more technical
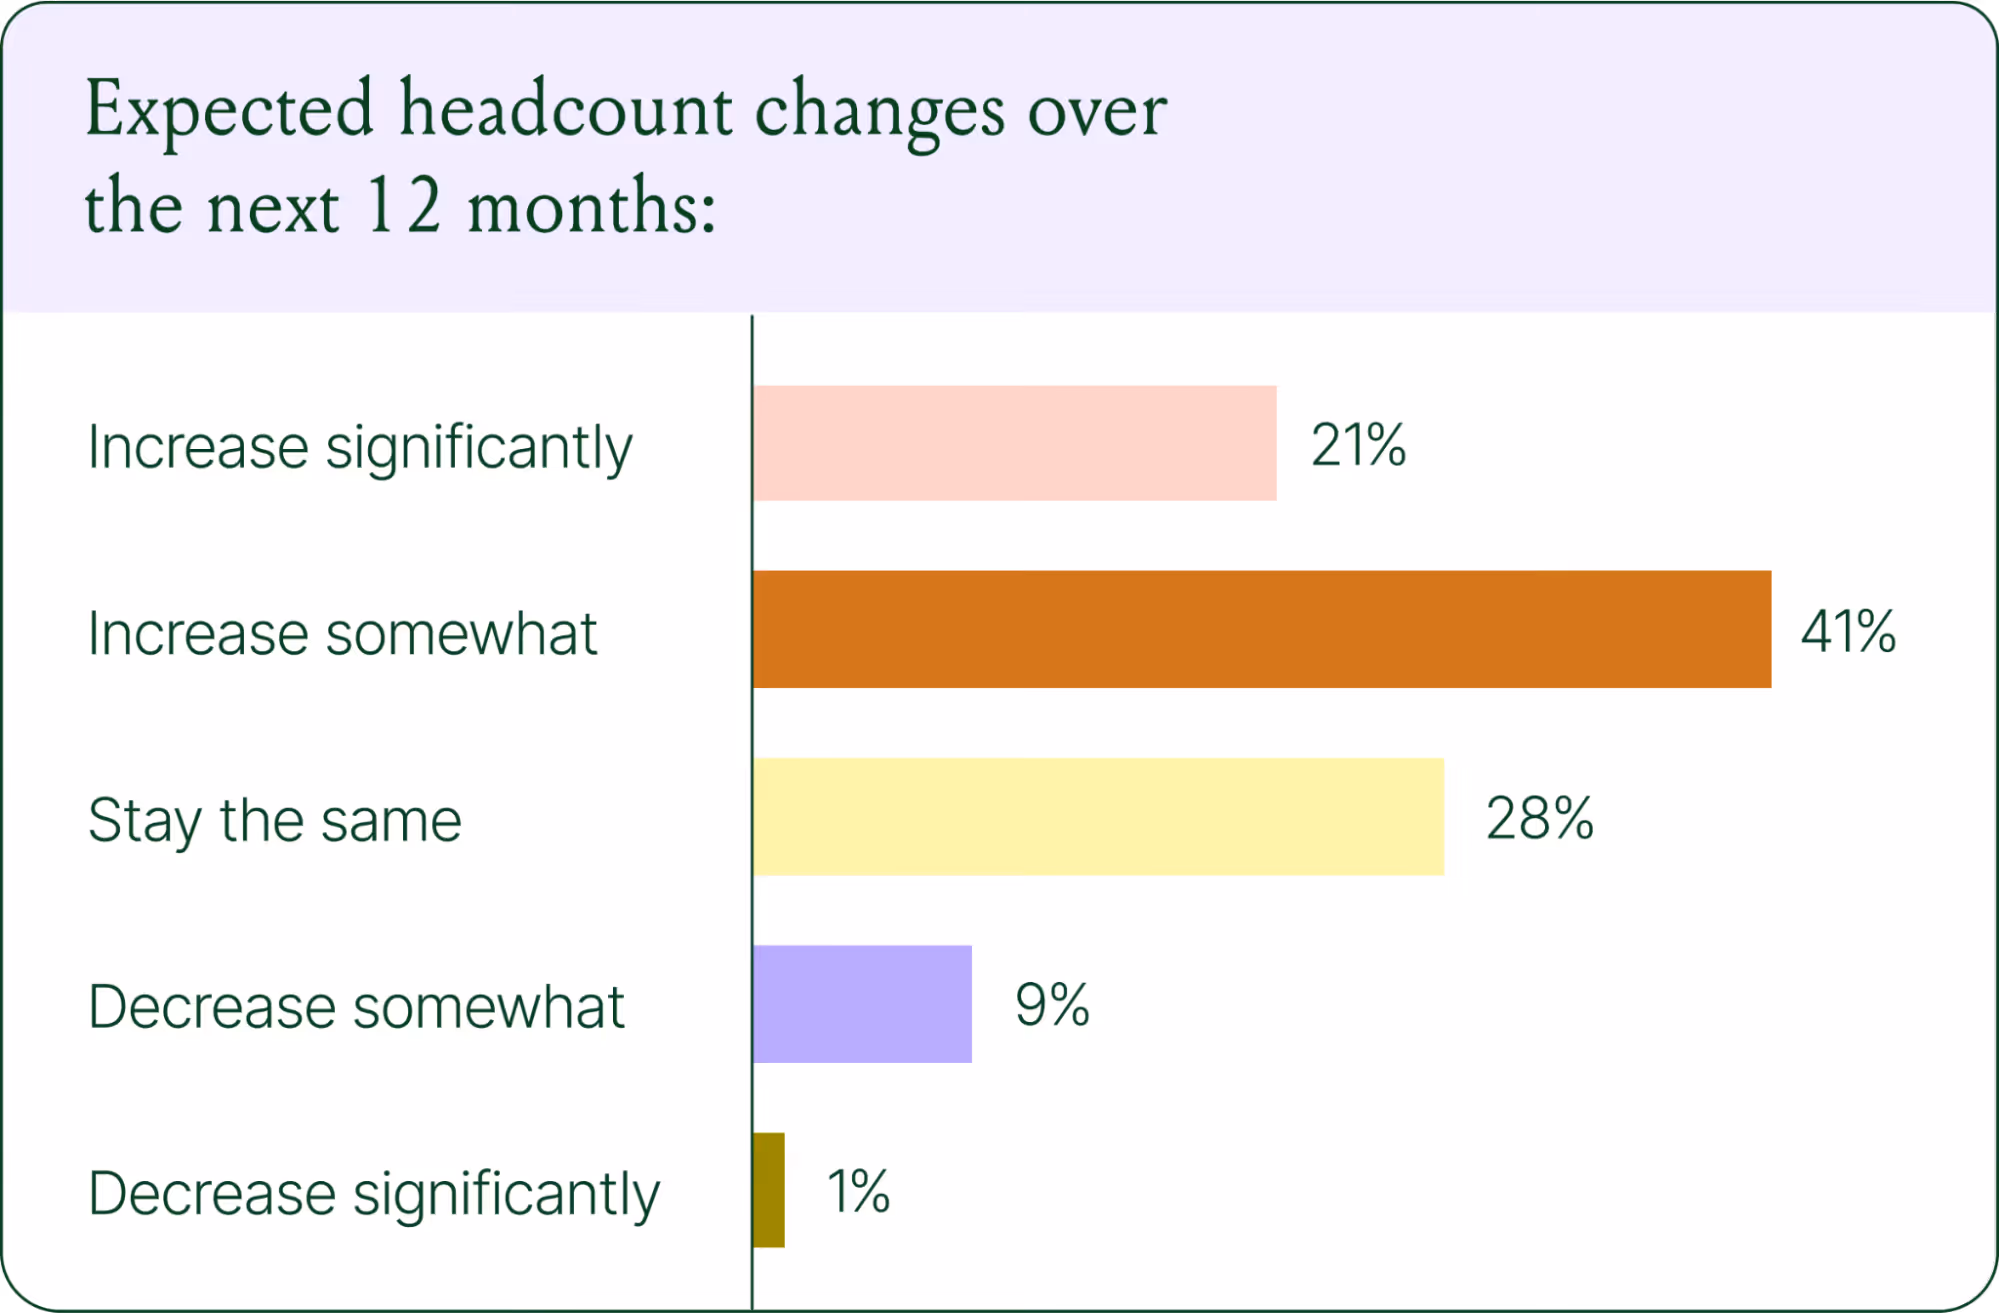
There's a persistent narrative that AI is making CX teams redundant. The data tells a different story. 62% of ecommerce brands are planning to grow their teams, not cut them. But the scope of those teams is changing.
New roles are emerging around AI configuration and quality assurance. Teams are investing in technical members to write AI Guidance instructions, develop tone-of-voice instructions, and continuously QA results.
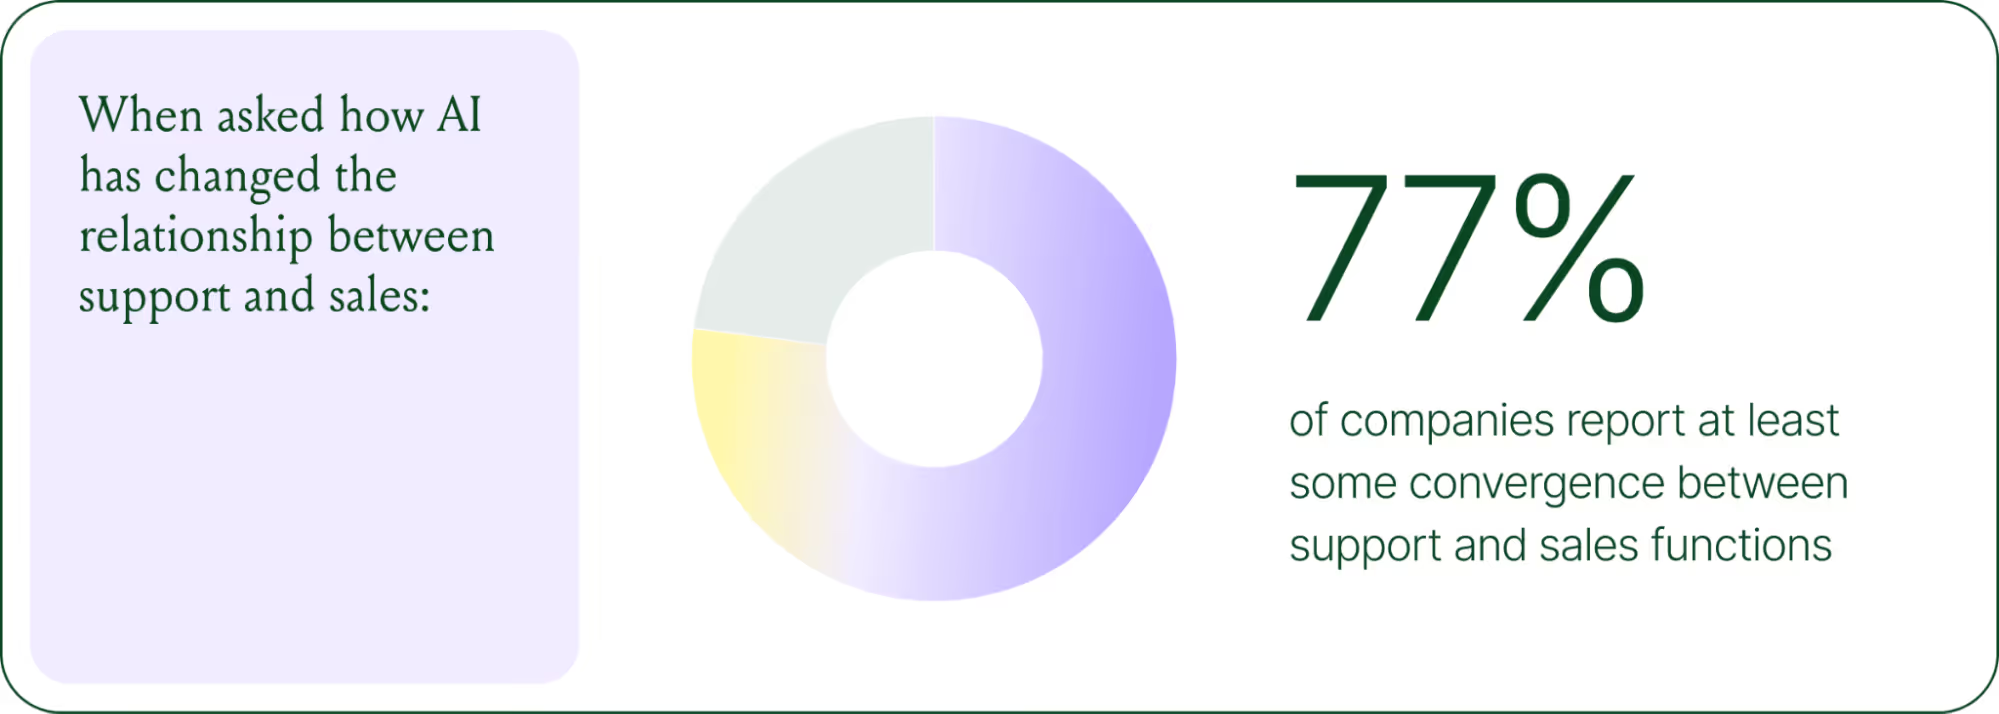
CX teams are also bridging the gap between support goals and revenue goals, as the two functions increasingly overlap.
The result is CX teams that are more technical than they were before. Agents who once spent their days answering repetitive tickets are now spending that time on higher-value work: complex escalations, VIP customer relationships, and improving the AI systems and knowledge bases that handle the volume.
Learn more about the evolution of CX roles in Trend #4.
Trend 5: The future is hybrid: AI-first, humans when it counts
Despite increasing AI adoption, data shows that ecommerce brands shouldn’t strive for 100% automation. Winning brands are building systems in which AI handles repetitive tier-1 tickets, and humans handle complex, sensitive cases.
AI handles speed and scale. It resolves order-tracking requests at 2 a.m., processes return-eligibility checks in seconds, and answers the same shipping question for the thousandth time without compromising quality.
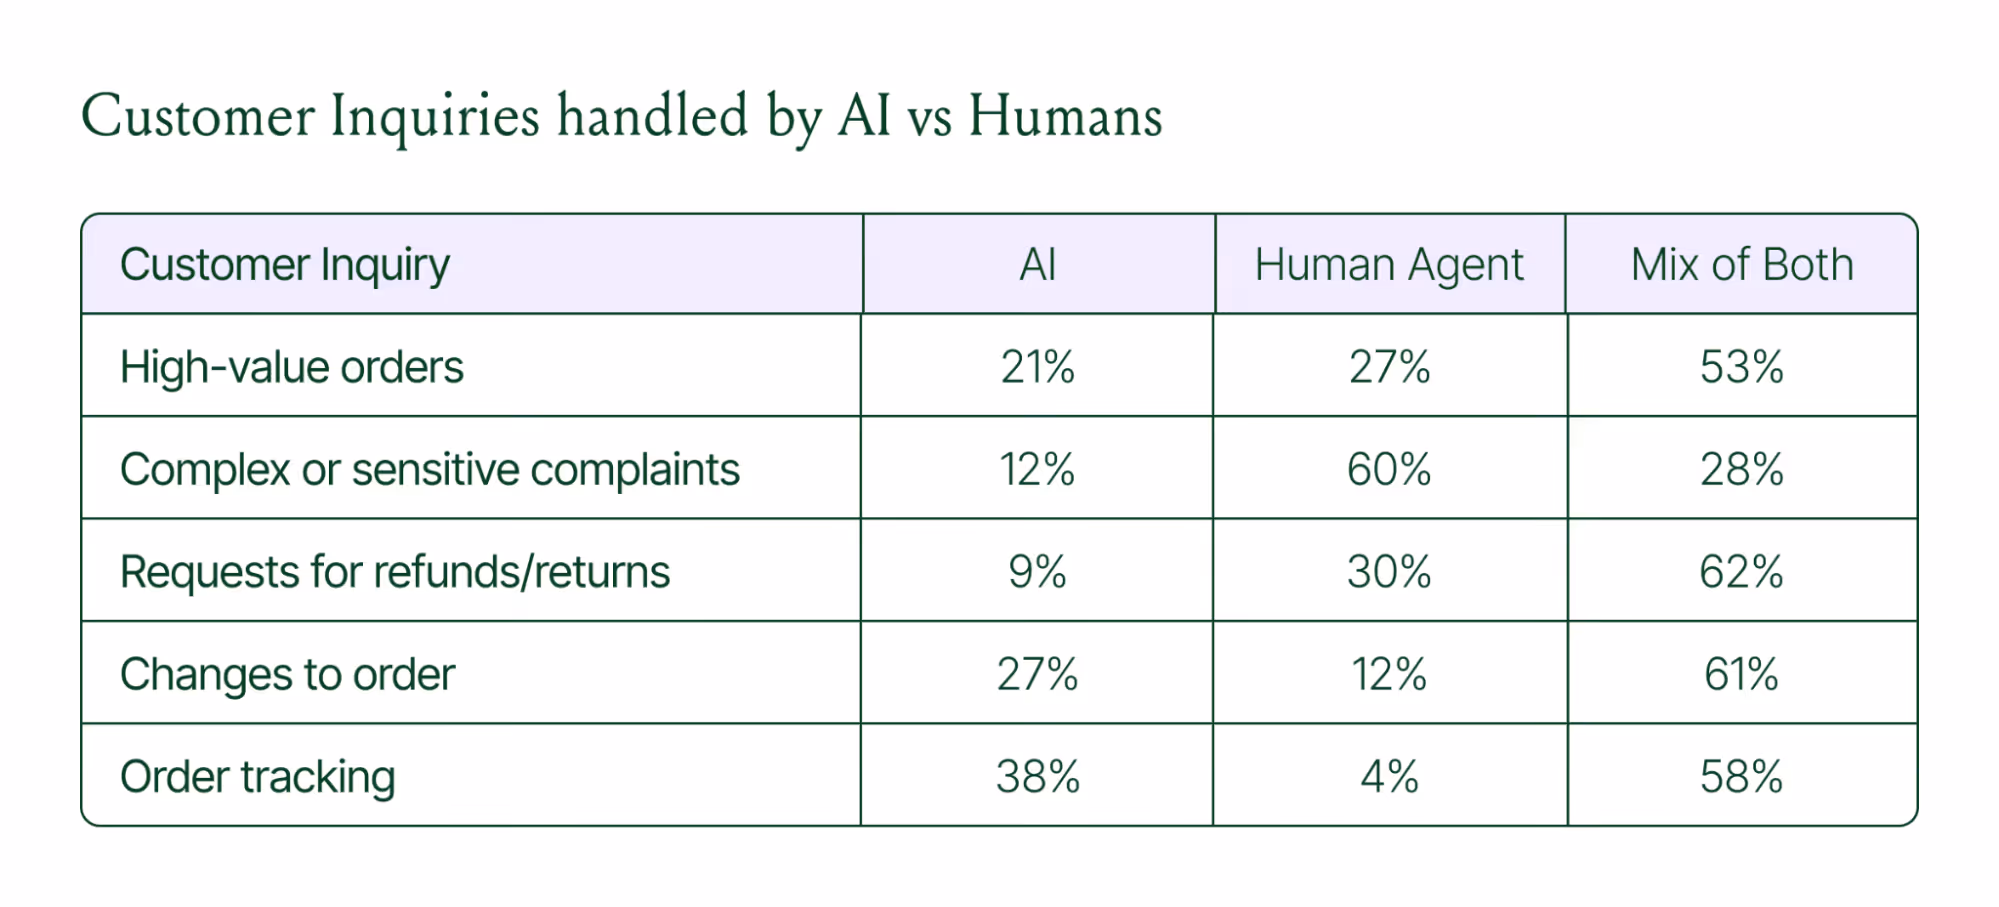
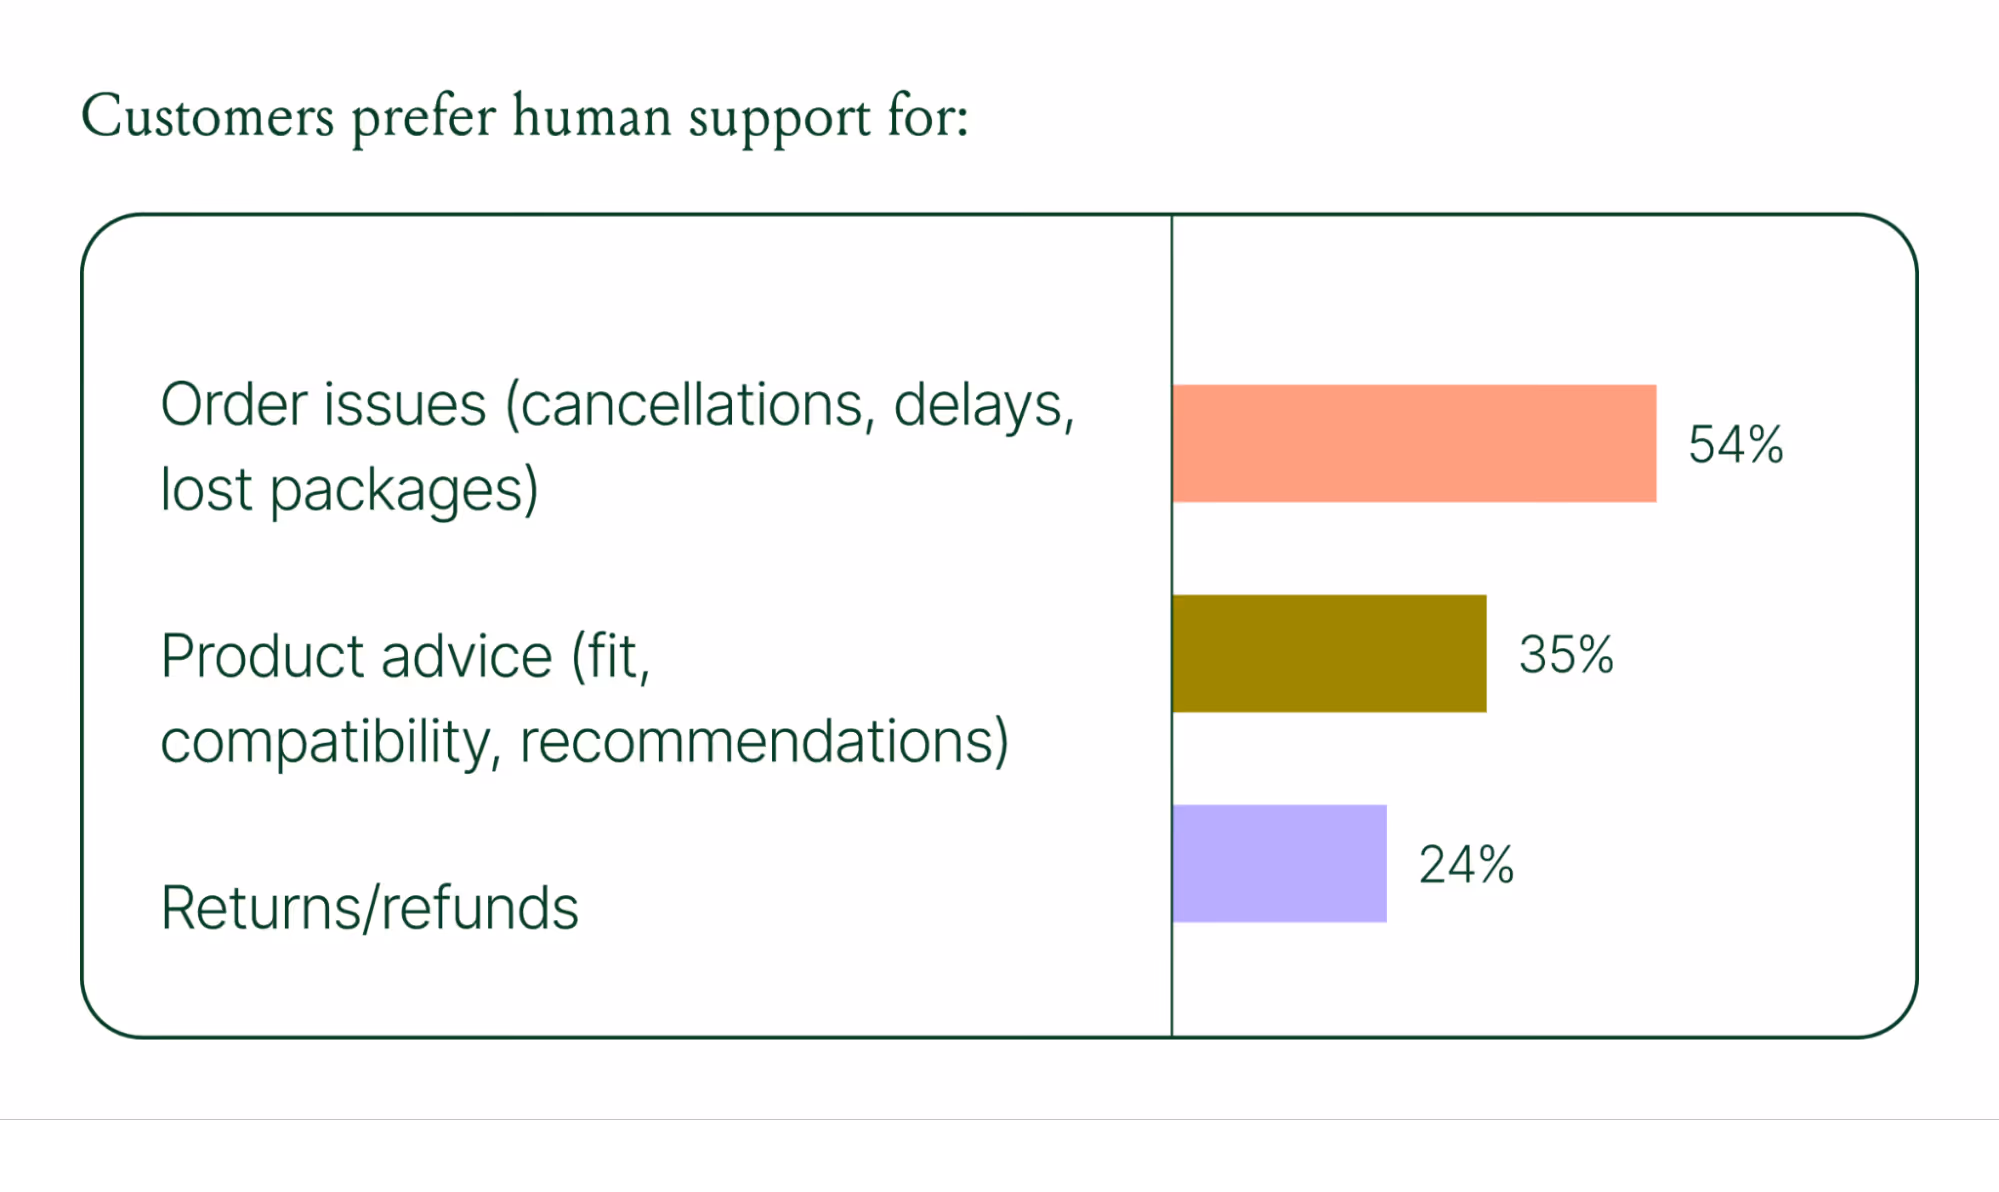
Human agents handle conversations that require context, empathy, or decisions that fall outside the standard playbook. There are several topics where shoppers still prefer human support.
Successful hybrid systems require continuous iteration, meaning reviewing handover topics, Guidance, and reviewing AI tickets on a weekly basis.
Discover how leading brands are balancing human and AI systems in Trend #5.
Where conversational commerce is heading by 2030
The 2026 trends are about expansion and standardization. The 2030 predictions are about what comes next.
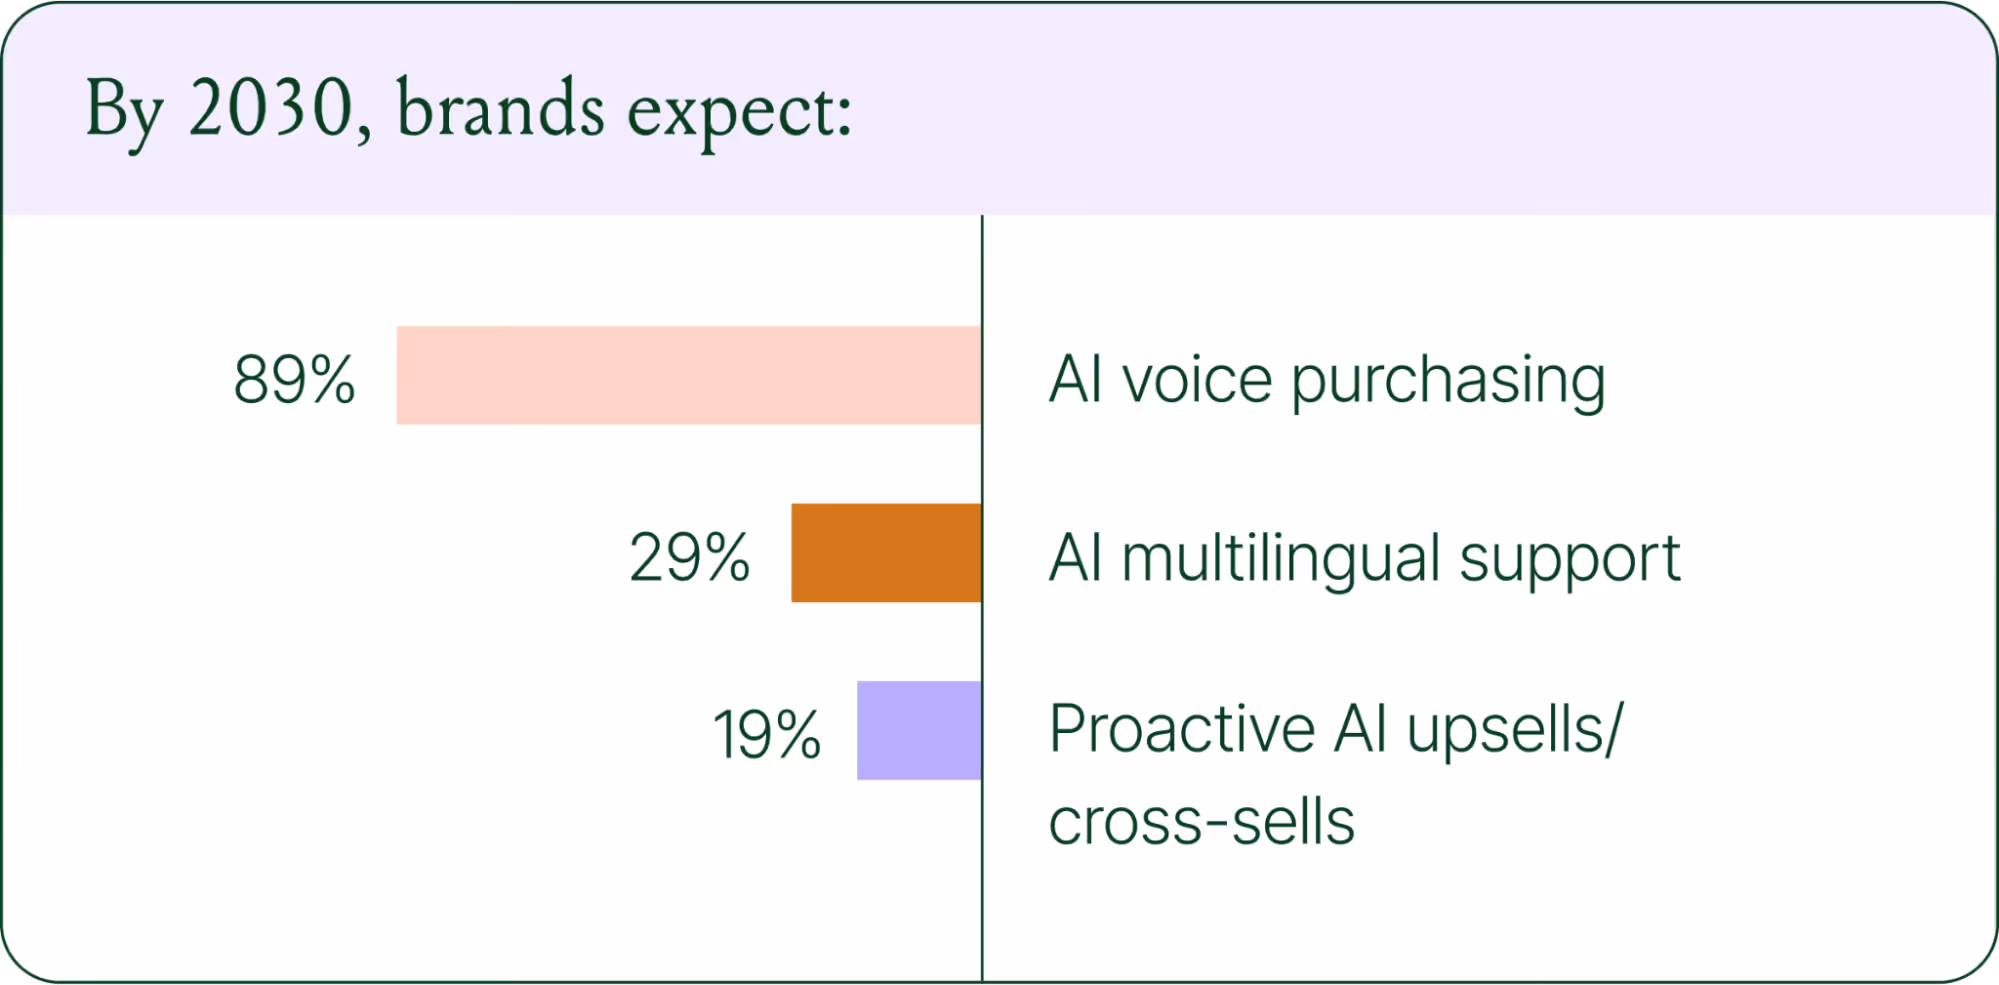
Voice-based purchasing is the biggest bet on the horizon. Only 7% of brands currently use voice assistants for commerce, but 89% expect it to be standard by 2030. The vision is a customer who can reorder a product, check their subscription status, or manage a return entirely over the phone.
Proactive AI is the other major shift. Rather than waiting for a customer to reach out, AI will anticipate needs based on browsing behavior, purchase history, and where someone is in their relationship with your brand. Think of it as the digital equivalent of a sales associate who remembers what you bought last time and knows what you're likely to need next.
Explore where ecommerce brands are allocating their AI budgets in the full report.
Start building your conversational commerce strategy today
The brands winning in 2026 are creating smart, scalable systems where AIhandles volume and humans handle nuance. They’re treating every conversational channel as an opportunity to serve and sell.
The data is clear: AI adoption is accelerating, customer expectations are rising, and the revenue impact of getting this right is measurable.
{{lead-magnet-1}}


2025 Ecommerce Trends: AI Adoption and Smarter Tech Stacks
TL;DR
- Ecommerce teams are overwhelmed by app overload, with 42% using six tools daily—leading to inefficiencies, rising costs, and poor customer experiences.
- Top brands are consolidating their tech stacks, choosing deeply integrated, ecommerce-specific platforms to simplify operations and lower costs.
- AI adoption and excitement are accelerating, with 77.2% of ecommerce professionals using AI daily and 55.3% rating their excitement as an 8-10 out of 10.
- Gorgias powers AI-driven support and sales in one platform, through a single workspace that helps ecommerce teams resolve faster, sell smarter, and operate more efficiently.
At Gorgias, we work with over 16,000 ecommerce brands and one common challenge emerges over and over:
Ecommerce tools are essential, but too many tools becomes a burden.
With different teams responsible for different functions, brands risk creating a disconnected tech stack that causes inefficiencies, reduces productivity, and ultimately impacts profitability.
Ecommerce teams are shuffling between tabs, copying and pasting order numbers, searching for customer data, and trying to piece it all together. It’s not only inefficient—it’s expensive, frustrating, and unsustainable as you scale.
So we dug into that data.
Our 2025 Ecommerce Trends Report surveyed ecommerce professionals across industries and job roles to understand what they really think about tech stacks and AI’s role in it.
{{lead-magnet-1}}
Ecommerce professionals are approaching app overload
There is now an ecommerce app for every possible use case a brand could need. But as businesses adopt new technologies for each part of their customer journey, their teams end up working out of dozens of platforms.
The study found that 42.28% of ecommerce pros use at least six apps daily to perform their role. Regardless of the number of apps used, integration and compatibility are a must. When technologies don’t talk to each other, you spend time context-switching instead of focusing on customer experience.

For Audien Hearing, Gorgias’s open API allowed them to create an integration with its warehouse software to manage returns directly in Gorgias rather than a shared Google spreadsheet. This integration helped them reduce returns by 5%, protecting their margins and leading to higher customer satisfaction.
Read more: How Audien Hearing Increased Efficiency for 75 Agents and Reduced Product Returns by 5%
Consolidation is the smartest move a brand can make
The most successful ecommerce brands aren’t necessarily using more tools—they’re using smarter tools. Leading businesses are opting for platforms that are deeply integrated, AI-compatible, and built specifically for ecommerce needs.
A growing tech stack also comes with a growing tech budget. Each new app has new costs, including subscriptions, set-up, management, and development fees. They quickly add up.
Nearly 40% of ecommerce professionals spend $5,000 to $50,000 annually on their tech stack.

Different roles have different priorities
We asked ecommerce professionals what they actually value in their tools. Unsurprisingly, the answer changed based on who we were talking to.
Top tool benefits included:
- Revenue growth for support leaders, revenue-focused roles, and founders
- Simplified workflows and time savings for support agents
There’s a clear difference between what ecommerce leaders and agents value in a tool and considering both is key to success.

Why brands hesitate to consolidate
Despite the benefits of using fewer, well-integrated tools, there are a few things that hold brands back from consolidating their tech stacks.
We asked respondents:
What, if any, are the biggest deterrents to consolidating your tech stack?
Top concerns are:
- Compatibility issues with existing software (52.4%)
- Direct costs (fees for software licenses, subscriptions, or customizations) (47.6%)
- Time required (40.3%)

AI adoption is accelerating—and it’s driving results
AI is dominating the world of ecommerce. It impacts every aspect of the customer journey, from brand discovery to the post-purchase experience. AI is actively reshaping the way ecommerce professionals work, so we wanted to know how they feel about it.
- 77.2% of ecommerce professionals use AI and automation to perform their role in 2025, compared to 69.3% in 2024.
- 55.3% of respondents rate their excitement for AI as an 8-10, compared to 45.6% in 2024.
Despite growing usage and excitement, teams still have their concerns with AI:

Read more: 8 AI Trends in Ecommerce: What’s Changing and How to Prepare
The AI shift—From just a support tool to a sales engine
The most impactful use cases we’ve seen aren’t just about reducing support ticket volume. AI is now driving revenue, increasing conversion rates, and enabling 24/7 coverage without expanding headcount.
Gorgias’s AI Agent is now capable of virtual sales assistance through personalized product recommendations, dynamic discounts to reduce cart abandonment, and cross-sells and upsells.
Top brands are already leveraging these new capabilities and seeing results. For example:
- TUSHY uses a Gorgias AI Agent to accurately answer pre-sale questions, leading to a 15% conversion rate, with AI Agent driving 2x more sales than human agents.
- Trove Brands enabled an AI Agent named Wally that cut misshipments by 70%, meaning reducing unwanted charges, avoidable fulfillment costs, high return rates, and customer frustration.
- Caitlyn Minimalist uses AI to reduce response times by 99% and saw a 150% increase in ticket conversions.
Gorgias: A one-tab tool for Conversational AI
We asked one final question to make ecommerce folks really reflect on how they work:
How many tabs do you currently have open?
The average ecommerce professional works with 22 open tabs. We’re not here to judge, but if you’re looking to close a few of those tabs, Gorgias might be what you’re missing.
Gorgias replaces all that complexity with a single workspace. From support to sales, order management to automation, it all happens inside one platform.
Ecommerce businesses can now leverage Gorgias’s Advanced AI for both support and sales. Within the same AI Agent, ecommerce brands can
- Fully resolve customer inquiries, not just respond
- Provide order tracking details
- Cancel, edit, and manage orders in Shopify and integrated apps
- Process returns and exchanges
- Provide tailored product recommendations
- Drive conversions
- And much more!
Get your copy of the 2025 Ecommerce Trends Report
This blog just skims the surface of what we uncover in our 2025 Ecommerce Trends report.
Want the full story?
Download the complete 2025 Ecommerce Trends: AI Adoption & Smarter Tech Stacks report to access:
- Data-backed insights and trends from ecommerce professionals
- The biggest barriers to consolidation—and how to overcome them
- Real-world case studies from leading brands like TUSHY, Caitlyn Minimalist, and July that are winning with AI
- Tactical recommendations to future-proof your ecommerce stack through AI-powered consolidation
{{lead-magnet-1}}
.avif)
5 Holiday Onsite Campaigns to Maximize Year-End Sales
Not sure where to go once the Black Friday and Cyber Monday excitement settles down? Don't worry—you're not alone. Many ecommerce brands will celebrate the uplift in sales from the four-day shopping frenzy without realizing there's a huge opportunity to keep the momentum going.
The holiday shopping season is your final chance to drive sales, delight customers, and end the year strong. These five proven campaigns will help you capture last-minute shoppers, increase repeat purchases, and maximize results.
1. Gift finder campaign: make gifting easy 🎁
Help shoppers find the perfect gift or gift bundle by linking existing resources in the campaign or offering pre-sales assistance through a conversational campaign (recommended).
Shoppers love personalized recommendations. A gift finder campaign highlights curated suggestions that simplify their decision-making.
- How it works: Trigger a message when shoppers spend over 15 seconds on a product page.
- Example message: “Looking for the perfect gift? This [product] is a fan favorite and pairs perfectly with [accessory]. Complete your gift with just one click!” OR;
- Example message #2: “Not sure what to get? We can help! Click here to chat with us about finding the perfect gift.”
- Why it works: Gift bundles increase average order value (AOV) by 20%.
Pro tip: Highlight top-rated products or seasonal bestsellers to build trust.

2. Last-minute shopper campaign: create urgency ⏰
Encourage quick action as deadlines approach.
Last-minute shoppers are in a rush, so combining urgency with a discount is the perfect motivator.
- How it works: Use an exit-intent popup during the final shopping days.
- Example message: “Still need gifts? Use code HOLIDAY10 for 10% off and get delivery by [date]. Hurry—time is running out!”
- Why it works: Exit-intent campaigns double engagement and reduce bounce rates by 37%.
Pro tip: ”You can also set a cart value threshold, ensuring that tailored offers are only provided to shoppers once they’ve added the minimum to their cart. You can also use a unique discount code rather than a generic code to drive a higher CTR.

3. Post-BFCM re-engagement campaign: boost loyalty 🔄
Turn Black Friday shoppers into repeat customers.
Reconnect with returning buyers by rewarding them for their loyalty.
- How it works: Display a personalized offer when previous shoppers return to your site.
- Example message: “Thanks for shopping with us on Black Friday! Here’s an exclusive 15% loyalty discount for your next holiday purchase.”
- Why it works: Repeat customers typically spend more, with a 10% boost in gross merchandise value (GMV).
Pro tip: Use the customer’s previous purchase to recommend complementary products.

4. AI-powered product recommendation: upsell effortlessly 🤖
Suggest relevant items to increase cart value.
Use AI to offer personalized product recommendations based on what shoppers are browsing or have in their cart.
- How it works: Show a message at checkout or when shoppers add an item to their cart, utilizing our tagging conditions to create highly targeted audience segments.
- Example message:“Love [product]? Add [related item] to complete the set! Customers who bought this also loved [product 2].”
- Why it works: Personalized upsell recommendations increase AOV by up to 15%.
Pro tip: Highlight frequently bought together items or exclusive bundles for the holidays.

You can easily set up product recommendations shown on your cart page with Gorgias Convert:

5. Holiday new arrivals campaign: spotlight seasonal exclusives ✨
Build excitement with fresh, holiday-themed products.
Shoppers love discovering new arrivals, especially during the holiday season.
- How it works: Target homepage visitors or holiday collection browsers.
- Example message: “Just in time for the holidays! Explore our exclusive [product line] and find the perfect gift.”
- Why it works: Announcements for new products increase conversions by 6%.
Pro tip: Use festive visuals and emphasize limited availability to drive urgency.

Don’t forget to A/B test your campaigns 🧪
Testing helps you discover what works best for your audience. Experiment with different offers, visuals, or CTAs to optimize results.
- Example: Test two versions of a free shipping upsell campaign.
- Version A: “Spend $15 more to get free shipping!”
- Version B: “You’re $15 away from free shipping. Add [product] to your cart now!”
- Result: Version B may outperform because it includes a clear product recommendation, reducing customer effort.
Pro tip: Track key metrics like click-through rate (CTR) and AOV to measure success.

These holiday campaigns are proven to boost sales and customer engagement during the busiest time of year. Use tools like Gorgias Convert to launch, personalize, and optimize your strategies seamlessly.
Don’t wait—end the year strong with campaigns that deliver results!
{{lead-magnet-1}}

How to Leverage Tools to Manage a High Volume of Sales on TikTok Shop
TikTok Shop generated 68.1% of gross market value sales across all social media platforms in 2024 and $3.8 billion in sales in 2023. Clearly, it’s becoming a massive channel with abundant opportunities for sellers.
To effectively harness TikTok Shop, however, brands with high-volume sales need to understand the specific challenges they will face when launching on the social platform.
Many of these are operational, like maintaining an accurate inventory list between platforms, supporting customers efficiently, and fulfilling a large number of orders.
When used together, AfterShip Feed and Gorgias can help you overcome these operational hurdles and start selling on TikTok Shop sooner.
{{lead-magnet-1}}
Streamline order management & customer support on TikTok Shop
TikTok Shop is the commerce-enabled side of TikTok, where brands and creators can list their products for sale. Shoppers then make a purchase through shoppable (in-feed) videos, live shopping, or product showcases. The app aims to provide a “frictionless checkout experience,” enabling shoppers to engage with their favorite accounts and add-to-cart in a flash.

While setting up a TikTok Shop is relatively simple, if you already run an ecommerce store that does a high volume of sales, adding TikTok Shop as an additional channel will be a little more complex. Thankfully, tools like AfterShip Feed and Gorgias can help you solve many operational issues and provide the same best-in-class customer experience on TikTok Shop as you do on your other channels..
Here’s a highlight reel on how you can implement both tools to improve efficiency and customer satisfaction, tackling issues like fulfillment or customer support inquiries from the same customers on different channels.
Centralize customer support with Gorgias

800+ Gorgias customers currently use the TikTok Shop integration. It’s quick and easy to connect. With it, you can:
Manage all customer interactions in one place
Coordinating customer support across different channels can be a pain. With Gorgias, however, you’ll be able to manage inquiries more efficiently and handle all shoppers’ messages by responding to TikTok Shop inquiries directly from Gorgias using text, images, and videos.
Additionally, you can address order-related issues and manage cancellations, returns, and refunds from TikTok Shop in the same Gorgias dashboard you use for your existing channels.
Automate ticket creation
Leverage Gorgias’s automated ticket creation to reduce First Response Time (FRT) and ensure that you don’t miss a single customer inquiry from TikTok Shop. Save time by handling repetitive tasks (like order status updates) with automation.
Enhance customers’ experience
Enabling the Gorgias TikTok Shop integration will allow you to maintain better control over communication and provide a consistent customer experience. Customers shopping via TikTok Shop will benefit from quicker responses, improving overall satisfaction and boosting brand loyalty.
Simplify operations with AfterShip Feed
AfterShip Feed is a reliable TikTok Shop management tool with 1,800 customers. It auto-syncs products, inventory, and orders between TikTok Shop and ecommerce platforms.
Partner AfterShip Feed with TikTok Shop to:

List on TikTok Shop more efficiently
AfterShip Feed makes listing high volumes of products on TikTok Shop easier through bulk uploads and editing, enabling you to update up to 10,000 SKUs at once.
It uses AI to add key product details and keep your product listings accurate and consistent. Tools like category templates and product ID generation make it even easier to list your full catalog.
Safeguard your revenue
AfterShip Feed has several features that will help you avoid lost revenue, especially during busy times like BFCM.

Inventory threshold
Inventory threshold helps you determine the minimum amount of inventory you need to have on hand to avoid selling out or buying too much. You can also set a fixed amount of inventory aside for TikTok Shop.
Price rules
Price rules help you set the ideal prices for each item you sell to protect your profit margins.
Fulfillment hold
A fulfillment hold stops an order at the fulfillment stage to ensure sufficient funds on the customer side, sufficient stock on yours—or to solve another issue behind the scenes. TikTok Shop has a standard 1-hour fulfillment hold, which can cause issues with inventory syncing on your main ecommerce platform.
Streamline order management
AfterShip Feed supports multiple fulfillment methods and integrates with many returns solutions. Sync orders from TikTok Shop with your existing fulfillment systems, ensuring timely and accurate deliveries. You can sync up to 24,000 orders to Shopify per hour.
Other features include order ID, shipping method, and product-SKU mapping.
Which are the top-grossing TikTok Shop industries?
Two industries in particular see massive sales from TikTok Shop: beauty and personal care, and womenswear and underwear. According to a 2024 report from Statista, the beauty category saw over 370 million sales and women’s fashion 284 million sales in 2023.

The beauty category alone has generated almost $2.5 billion in GMV, while the womenswear category has seen $1.39 billion.
If your brand belongs to one of these categories, including Gorgias and AfterShip Feed in your TikTok Shop toolkit could be a great fit for you.
Gorgias and AfterShip create better experiences
Pairing Gorgias and AfterShip Feed will help you deliver a fantastic customer experience and grow your business on TikTok Shop.
Building delightful customer interactions starts in your inbox
