

Newsletter Signup
The best in CX and ecommerce, right to your inbox
Featured articles
Ticket Volume: How to Measure It, Benchmark It, and Reduce It
Gorgias AI Agent Pricing, Explained
Introducing Helpdesk 2.0: Built for How Agents Work
TL;DR:
- Built directly from agent feedback, Helpdesk 2.0 fixes real workflow pain points. The redesign focuses on reducing friction and helping agents handle more context-heavy tickets.
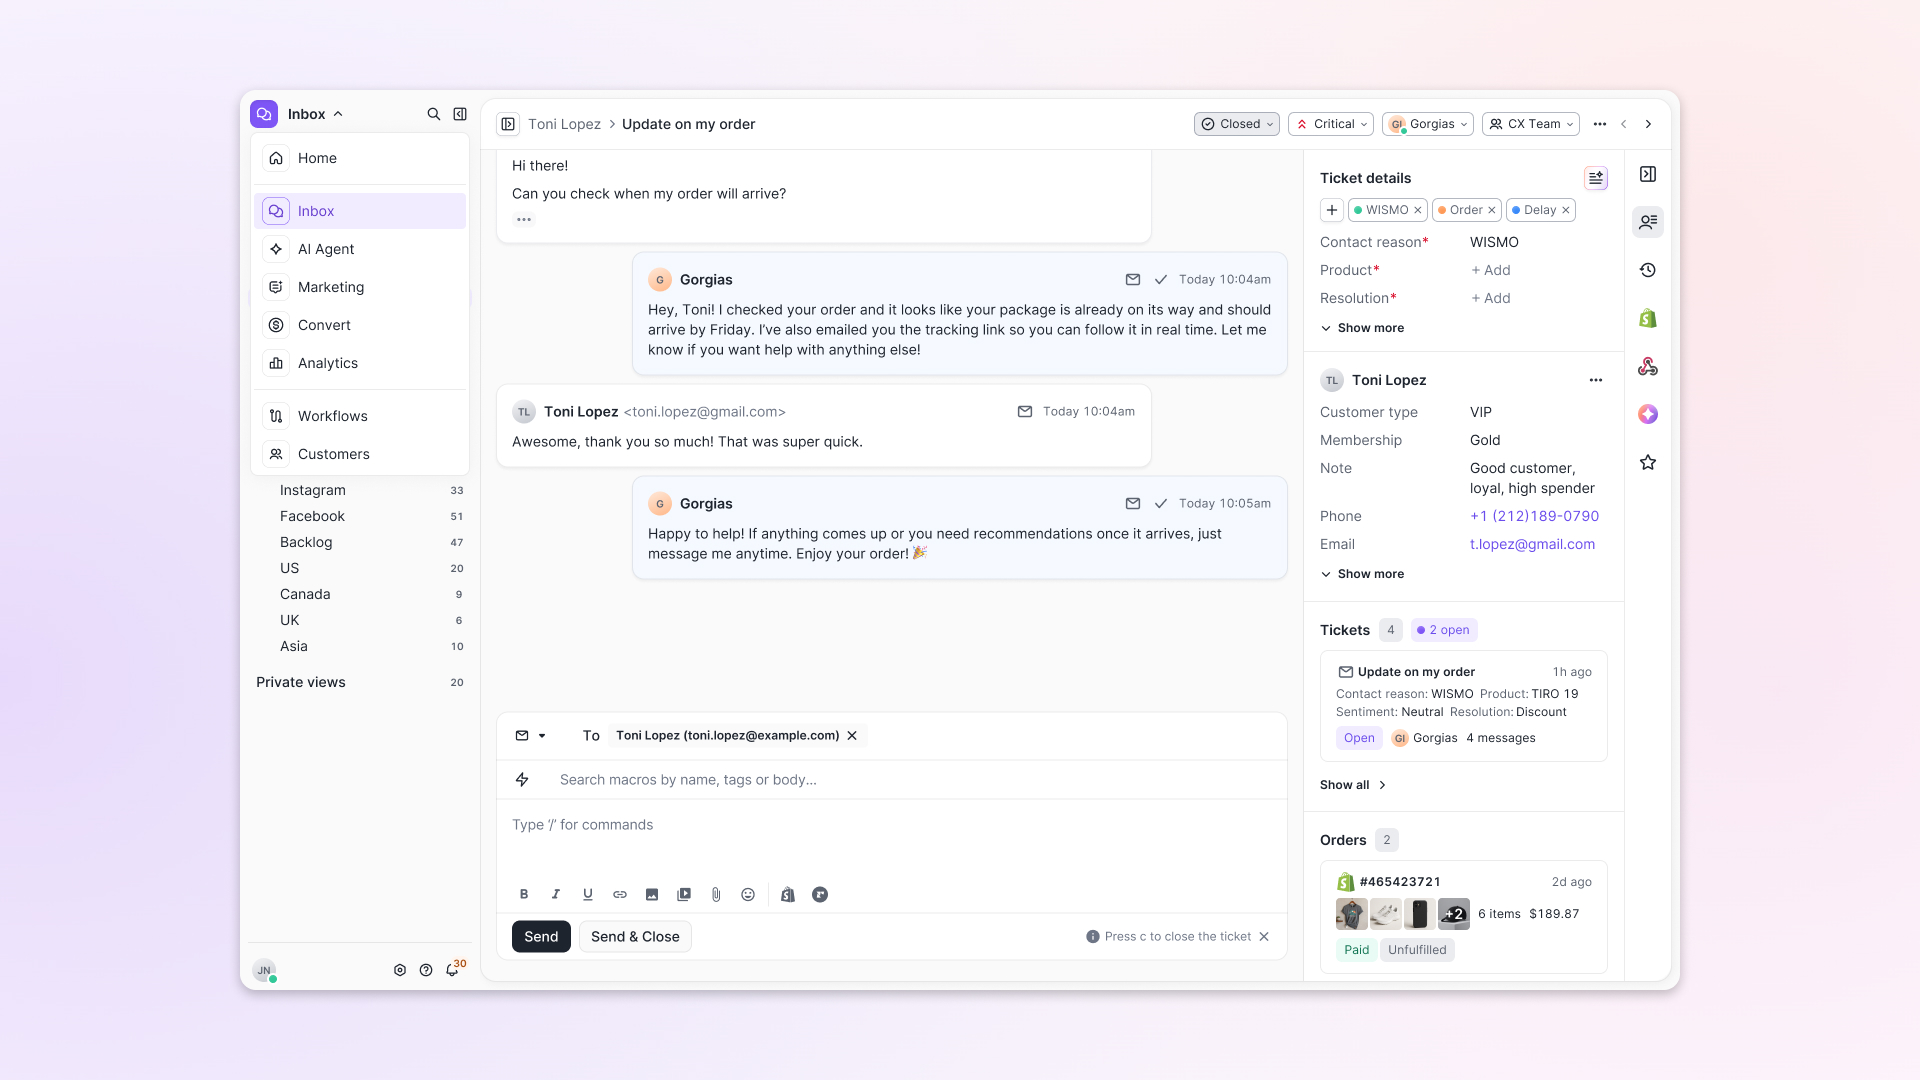
- A chat-style interface replaces the old email layout. Conversations are easier to follow and resolve in one view.
- Customer context is shown beside the conversation in a right-side panel. Agents can view history, orders, and details without leaving the ticket.
- AI handoffs come with clear summaries. Agents instantly see what happened, what was tried, and what to do next.
- Navigation is simpler and faster across teams. Clean menus, structured queues, and multi-store access keep agents moving efficiently.
Helpdesk 2.0 starts with the people who use it most: the agents.
We spent time understanding customer support from the agent's seat. What do they reach for constantly? What slows them down? What does a better workday look like?
Everything we found is in this brand-new update.
Why we redesigned Helpdesk
Conversational commerce is the new standard.
In customer support, this means customers expect context to remain intact wherever they reach out, whether a conversation starts on social, moves to email, or ends on a call.
This new approach to support has also changed the agent's role. Recurring tickets, like order status checks, shipping updates, and returns, are now handled by AI. What lands in the agent inbox are edge cases that require human judgment and troubleshooting, or tickets that require the full picture.
However, the original Helpdesk was built for a different era of support.
Context was separated across views rather than built into the conversation itself. It's something one in five Gorgias customers flagged, through support tickets, NPS surveys, and conversations with our team. So, we got to work.
Helpdesk 2.0 is the result.
What's new in Helpdesk 2.0
Here's a look at everything that changed.
Read conversations the way they're meant to be read
Conversations have a natural rhythm, one that’s already found in every messaging tool we use. We brought that same layout into the helpdesk.
Say goodbye to the 2000s email interface and hello to chat bubbles. This updated design changes how quickly you can orient yourself and resolve the ticket in one go.
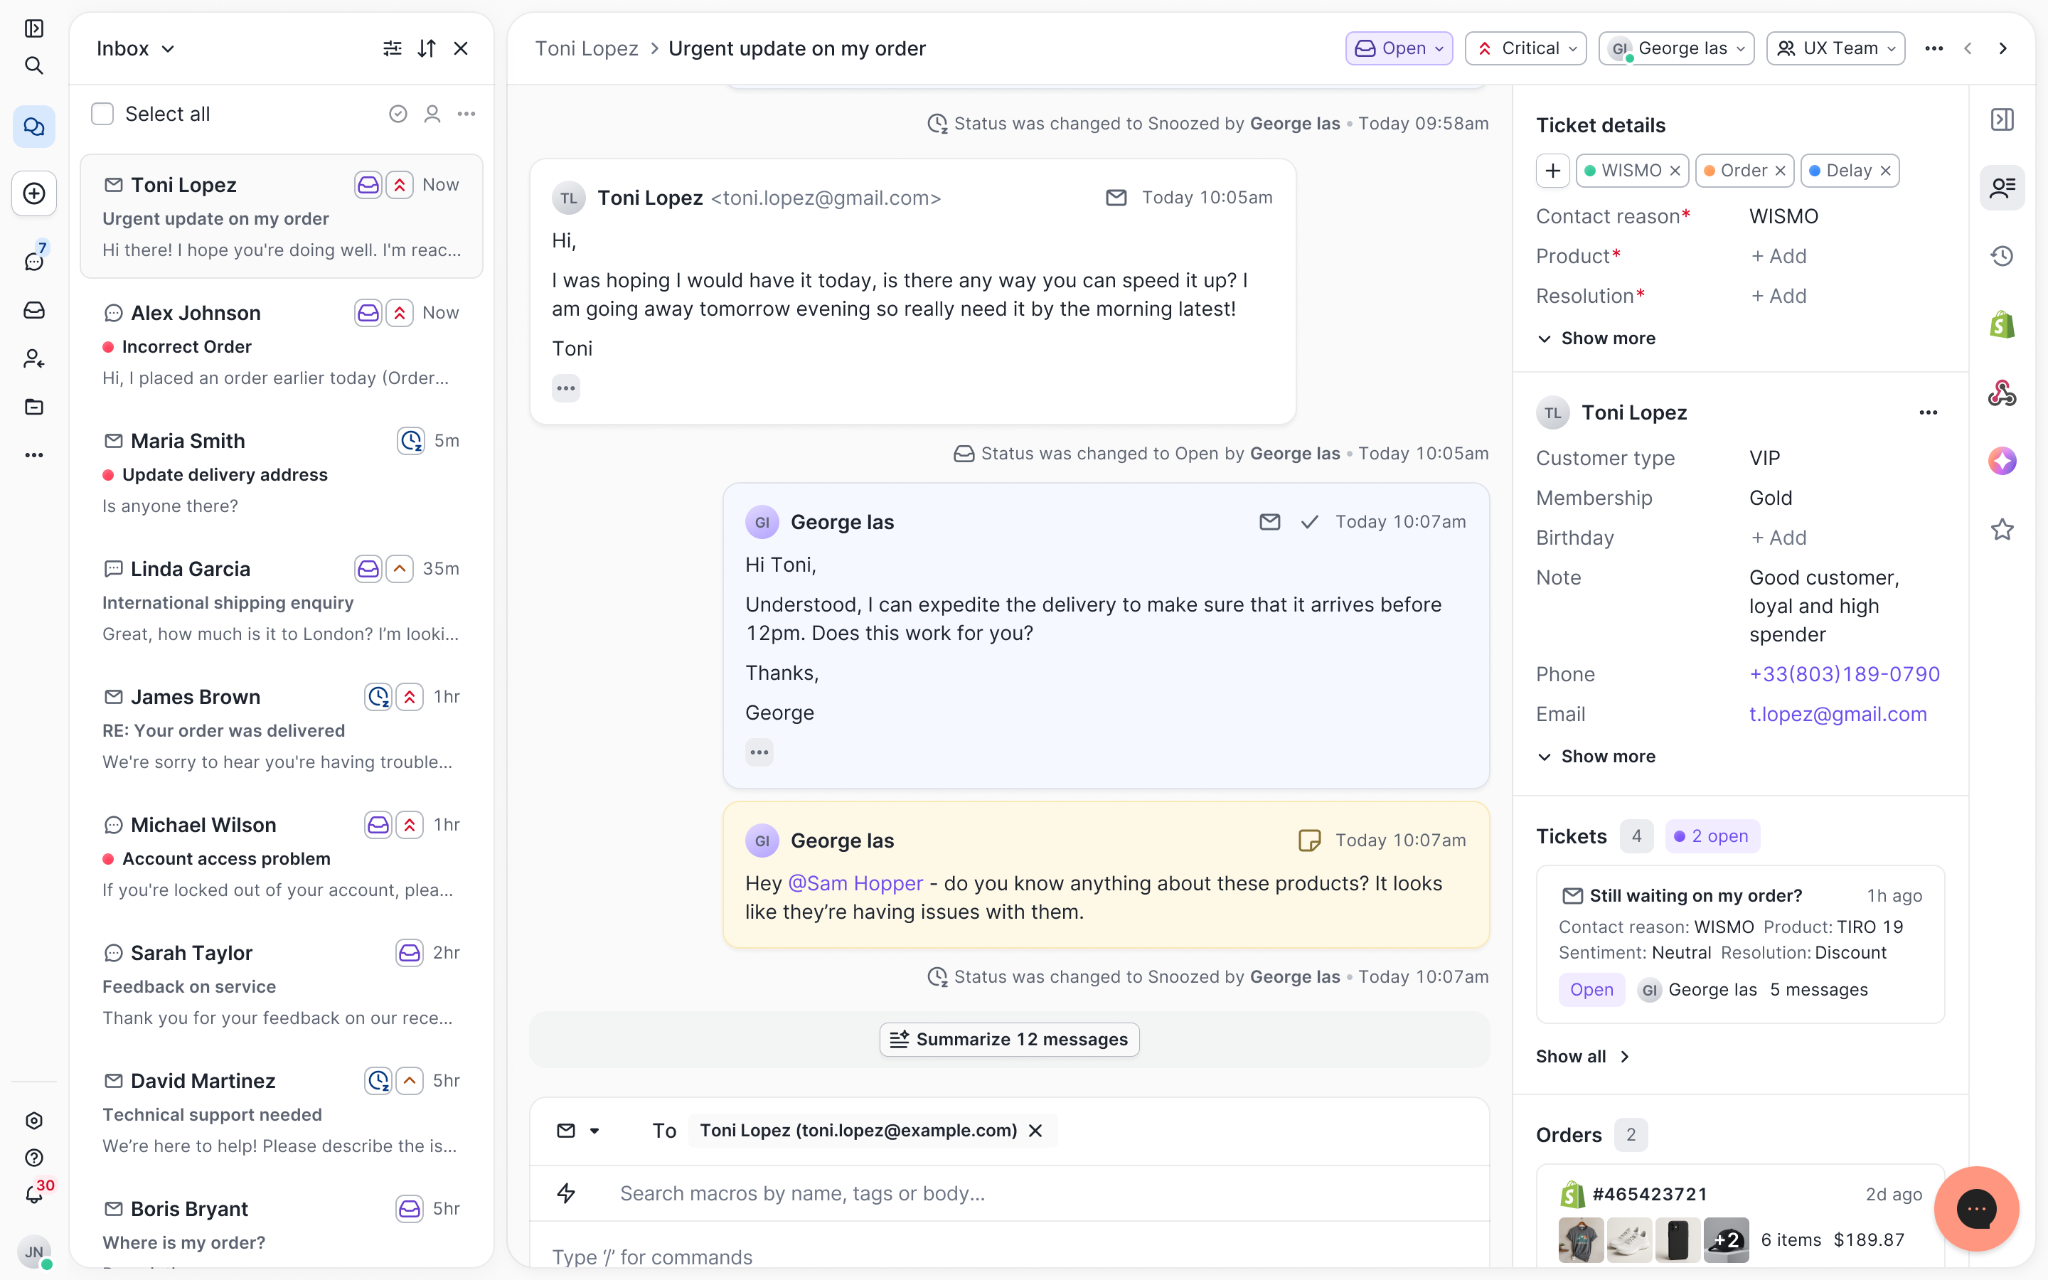
Chats with customers now look like real conversations, using the speech bubble style you’re familiar with on popular messaging apps.
Check customer history without losing your place
Checking a customer's history used to mean leaving the conversation, an extra step that interrupted what should have been a smooth workflow.
Now, past conversations open in a sidebar next to the active conversation. You can view a customer’s full history, search through their timeline, and open prior tickets without going to a new page.

Check past conversations, orders, and customer details in the brand-new Customer Timeline.
See order details the moment you open a ticket
Order information is easier to reference than ever. Open a ticket, and you instantly see the customer's recent orders, marked with product images and invoice details at a glance. Need to dig deeper? Click on an order, and the expanded information appears in the same panel.
For teams using custom integrations, apps are fixed in a quick-access integration menu on the right.
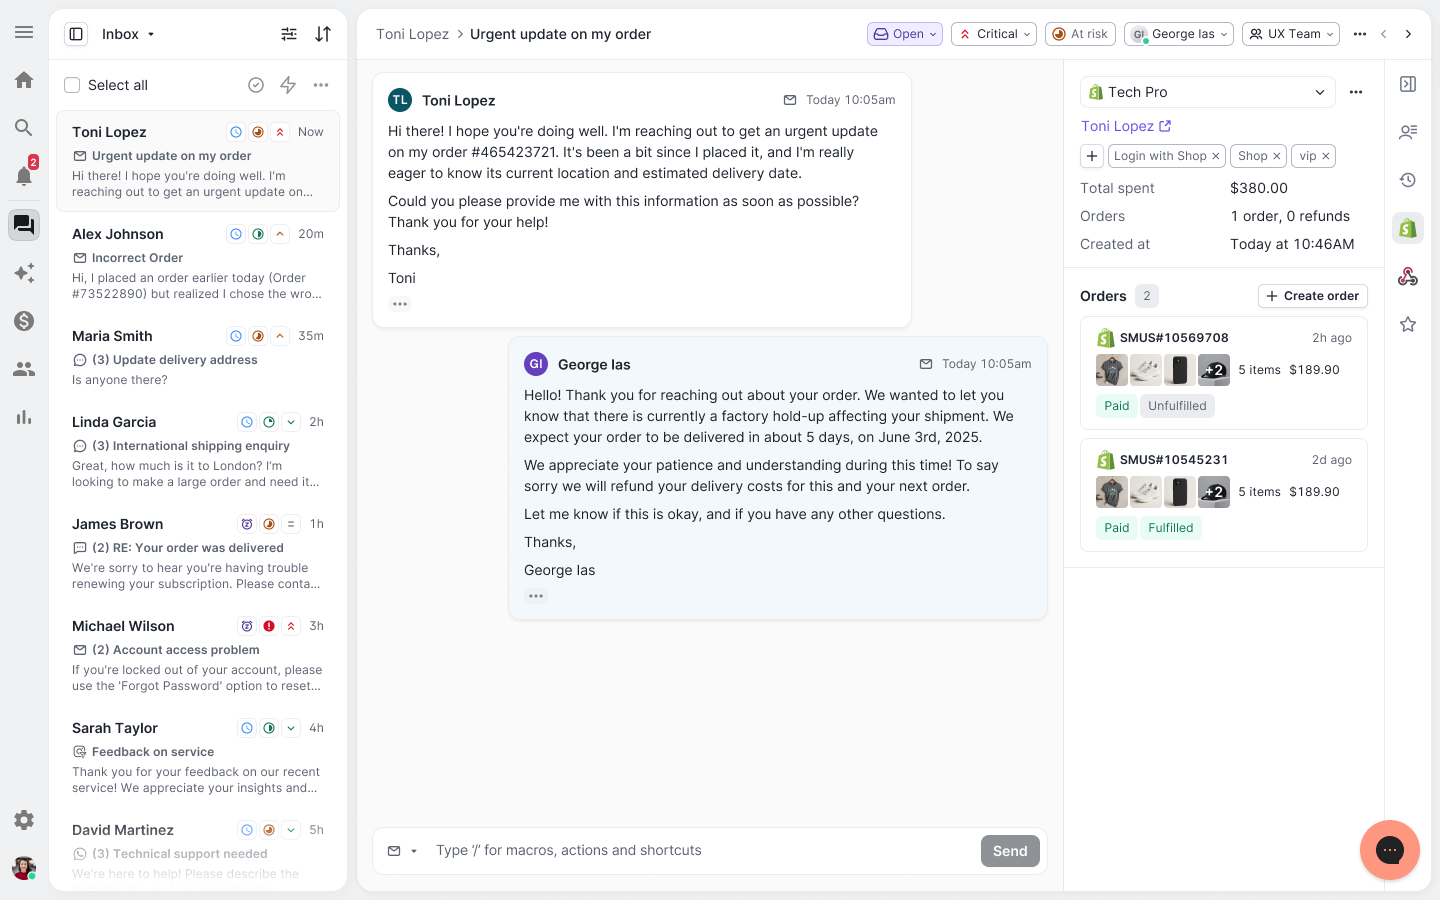
See order details, product images, and totals at a glance on the right panel, without leaving the conversation.
Pick up where AI left off
You shouldn't have to dig through a thread to figure out what AI already tried. Now you don't have to.
When AI Agent escalates a conversation, it includes a concise handover summary that mentions the issue, what actions were taken, and why it was passed to your team.
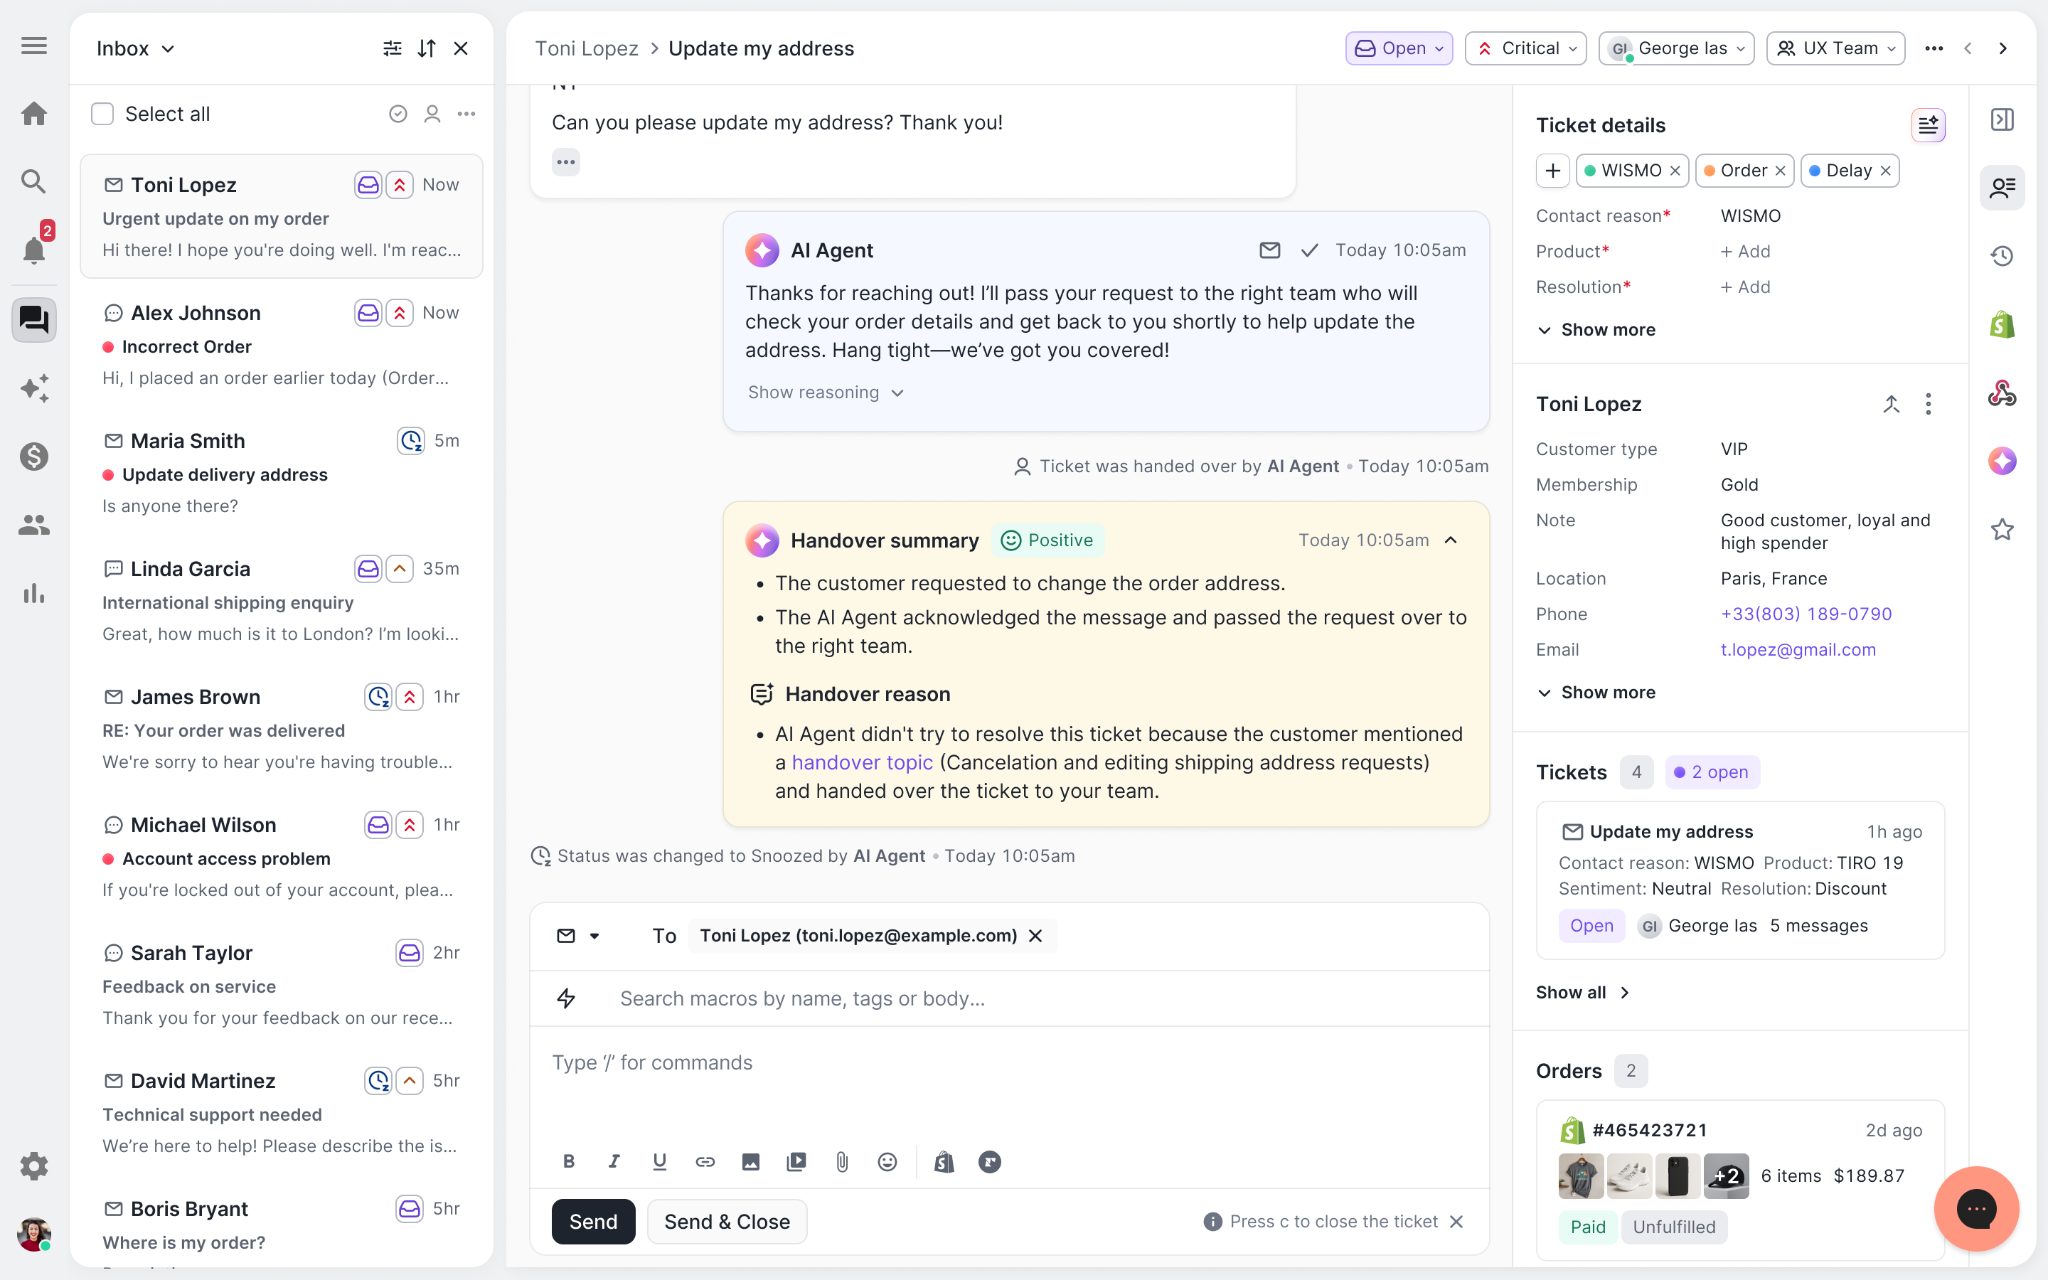
Escalated tickets include a brief AI-generated handover summary, marked in yellow, for quick reference.
Move faster across every store and team
We restructured and simplified the navigation. The left sidebar organizes everything into clear categories: Inbox, AI Agent, Marketing, and Analytics, so anyone on your team knows exactly where to go.
To quickly update your knowledge base or adjust a workflow, both now live right in the sidebar. For teams managing multiple stores, switching between them is just as straightforward, accessible from the sidebar, so agents can move between inboxes without breaking their flow.
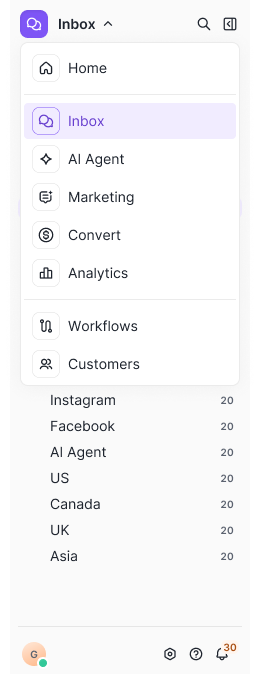
Agents can switch between stores and their corresponding inboxes directly from the left menu.
A workspace that works the way agents do
Support comes down to the person on the other end of the conversation. We built Helpdesk 2.0 is to make sure they have everything they need to show up for that moment.
The best way to see the difference is to work in it. Start a free trial today.



Further reading

Order Fulfillment for Ecommerce: Process, Tips, & Tools
Gone are the days when a customer places an order online without considering order fulfillment. They want free shipping, two-day shipping, and live order tracking — and that’s just table stakes.
Big ecommerce brands and marketplaces, especially Amazon Prime, have trained customers to expect their orders will arrive as soon as the next day and with absolutely no hassle. That creates challenges for small and medium businesses now tasked with achieving similar results.
Your ecommerce business may not have the resources for next-day delivery, but having online orders arrive quickly and smoothly is non-negotiable. Slow or frustrating order fulfillment can easily trigger a product return or a negative review, and will likely prevent a customer from turning into a repeat customer.
Even small brands can optimize their order fulfillment process, from taking in and storing inventory to taking return requests, and deliver great results every time.
What is order fulfillment?
Order fulfillment is the sequence of steps that starts after a customer places an online order, and ends when your customer receives their order. It includes order intake, order picking, assembling, packing, shipping, and order tracking.
 |
Some companies include post-delivery communications in this category, while others put that communication into another category, like customer support or onboarding.
All organizations rely on some third-party assistance within the order fulfillment process — even if you’re a solo business owner who handles most of the order fulfillment process in house (like inventory storage and order processing), you use a delivery carrier like FedEx or USPS to drop off packages.
Other businesses lean on more outsourced fulfillment solutions to manage warehousing and ship orders, such as a dropshipping partner or third-party logistics (3PL) operation. Self-fulfillment is quite time-consuming for stores with high volumes of orders, so you’ll likely outsource more of the order fulfillment process as you grow.
Common challenges of order fulfillment
Companies frequently run into several common hurdles when building an ecommerce fulfillment strategy, especially as they grow and scale. Processing more customer orders is a good thing, but only when businesses can keep up with customer expectations around their fulfillment needs.
 |
Do any of these order fulfillment challenges sound familiar to your business?
- Poor inventory management: Frequently being out of stock (or, worse, selling items you don’t have in stock) hampers your sales potential and harms the customer experience.
- Low shipping quality: When you hand packages off to a shipping carrier, much of the shipping process is out of your hands. Yet, customers still blame you when items don’t arrive or show up damaged.
- Too much stock: Keeping too much stock on hand affects storage and carrying costs, and you can end up stuck with unsellable items that have gone out of style, out of season, or otherwise become unpopular.
- Supply chain breakdown: When one or more links in your supply chain are unable to keep up with demand for inventory.
These issues are common, but they add up over time, diminishing your customer experience (CX) and growth potential. Building loyal customers is key to repeat business and a poor fulfillment strategy put that at risk. Every time a customer has to reach out about an issue in the process, you’re a step closer to losing them.
Even if you have the fastest, friendliest customer service team around, a fulfillment operation that doesn’t require customers to reach out is always preferred.
 |
📚Related reading: Our list of revenue-driving ecommerce shipping best practices.
Why is order fulfillment important for ecommerce businesses?
Why pay close attention to your order fulfillment strategy? Because it’s what ensures your customers get what they ordered, when they expect it.
As many as 90% of online shoppers see 2-day and 3-day delivery as the standard, with 30% of shoppers saying that they expect same-day delivery. In fact, the same-day delivery market in the US is expected to grow by more than $9 billion from 2020 to 2025.
What’s more, Arvato finds that 54% percent of U.S. shoppers have walked away from a purchase because of the cost of delivery, and 27% percent have done the same because the ecommerce business didn’t have fulfillment options that arrive in time.
Providing a delivery estimate is also key. A 2020 report from Navnar found 68% of customers said estimated delivery time during the checkout process influenced their decision to complete a purchase.
The bottom line is that customers expect fast, cost-effective, and transparent shipping if you want to win their business and loyalty.
 |
How does the order fulfillment process generally work?
Let’s take a step back to the basics and look at how the order fulfillment process works for the typical ecommerce business selling on an ecommerce platform.
Each of these steps has its own set of intricacies and details, and it’s easy to overlook something in one or more of these areas. Looking at each step before getting any deeper in will help you better assess what your business needs to handle — and how to go about doing so.
1) Receiving inventory
Receiving inventory is the process of taking stock into a warehouse or fulfillment center. Before you (or your order fulfillment company) can ship products to customers, you (or they) must first have products to ship.
 |
Depending on how your business is structured, inventory can come from your own production facilities, from other companies directly, or from third-party or intermediary services.
Part of the receiving process is counting and inspecting incoming stock for damage. Categorizing or labeling starts here and continues in the next step.
2) Storing inventory
Any products you don’t immediately process and ship need to be categorized, logged, and stored, usually using a stock-keeping unit (SKU). Some larger businesses may also use some other kind of barcode or radio-frequency identification (RFID) tracking system to help with inventory management.
 |
Items are placed into inventory storage, either in your warehouse (whether that’s a large facility or just your garage) or in your fulfillment service center or third-party logistics partner’s warehouse.
This step encompasses a lot, as your strategy here dictates how much time and labor goes into finding and packing items later on. For example, digital inventory management systems are crucial for tracking and locating items stored in inventory.
3) Processing the order
Processing an order involves developing a system to find items, pull them from the inventory, and then pack them once a customer places an order.
 |
This could look like you going to your at-home inventory and packaging the items, or your fulfillment partners taking your items from a warehouse. It all depends on the size of your business.
You can streamline and track order processing Gorgias and with apps that integrate into Gorgias such as ShipMonk and Bigblue. ShipMonk, for example, pulls order fulfillment data and tracking information right into Gorgias helpdesk.
There’s also ShipBob, a 3PL that takes care of order fulfillment for ecommerce businesses. ShipBob integrates with Gorgias to pull all your customer orders fulfilled by ShipBob into a single account.
4) Shipping the order
This step is when your team (or your 3PL) hands off the order to a transportation channel (for example, shipping carriers like FedEx, UPS, and USPS).
 |
This is the step where your strategy most directly influences the costs your business incurs. The packing materials, weight, and sizes you choose get calculated into a measurement called dimensional weight (DIM weight), which generally determines how much you pay in shipping costs.
This is an opportunity to communicate shipping notices to the customer. AfterShip provides tracking for you and transparency for customers and integrates with Gorgias so you can quickly access shipping information when communicating with customers.
Providing detailed shipping information is a crucial step of your fulfillment process. According to Optimroute, 24.6% of customers said they were “extremely likely” to buy again from a brand that provides real-time order tracking.
Shipping is deep into the process, but your shipping options greatly impact your incoming sales. Shipping costs are the most common reason behind abandoned carts: According to the Baynard Institute, 48% of customers will abandon a cart if shipping costs are too high, and 22% will do the same if the delivery time was too slow.
 |
📚Recommended reading:
- 12 Best Shipping Software Tools for Ecommerce Stores
- 9 Revenue-Driving Ecommerce Shipping Best Practices
- How To Provide Order Tracking for Your Ecommerce Customers
5) Handling returns
Any ecommerce business must have a process for handling returns in place, and this crucial function usually falls under order fulfillment. Your returns procedures must establish when returns are and are not accepted, along with how to determine which returns can be restocked and which cannot (e.g., soiled or defective items).
 |
You need to be prepared for returns as they’re guaranteed to happen. In 2021, shoppers returned over 20.8% of products ordered, according to the National Retail Foundation. Items returned in 2021 alone were worth a total of $761 billion.
Again, apps can make this all easier. Loop Returns, for example, automates returns for Shopify merchants. Loop and Gorgias work together to place all your returns data inside the Gorgias helpdesk.
📚Recommended reading:
- 9 Best Returns Management Tools for Easier Returns
- Ecommerce Returns: 10 Best Practices for Taking Your Online Store to the Next Level
The 4 types of order fulfillment
While the broad strokes we just outlined are fairly consistent, the details of order fulfillment are different from company to company, as are fulfillment costs.
Most businesses fall into one of four categories or types of order fulfillment. Below, we’ll detail each of these four categories: in-house order fulfillment, third-party order fulfillment, dropshipping order fulfillment, and hybrid order fulfillment.
In-house order fulfillment
In-house order fulfillment is what it sounds like — the business handles all the steps listed above internally (aside from the actual shipping). Employees or contractors for the ecommerce business receive and store inventory, pick and pack orders with a shipping label and packing slip, and handle the customer relationships that accompany each order.
In-house is common on two extreme ends of the spectrum: smaller, low-volume businesses and startups (where packing boxes doesn’t consume too much of any one person’s time), and major enterprises (think Amazon).
📚Recommended reading: How to Offer Free Shipping and Lift Revenue
Third-party order fulfillment
In a third-party model, everything about the order fulfillment process is outsourced to a third-party logistics company. Outsourcing to a third-party fulfillment provider like the Shopify Fulfillment Network, Amazon FBA, Amazon MCF, or Deliverr is a highly strategic choice for ecommerce businesses that have grown to a certain order volume but lack order fulfillment infrastructure.
Using an order fulfillment service also makes sense for firms with volatile or seasonal sales patterns, where maintaining as much storage space as possible is unsustainable during slower seasons.
📚Recommended reading: Shopify Fulfillment Network Review From an Ecommerce Merchant
Dropshipping order fulfillment
Dropshipping is when an ecommerce store doesn’t keep items in stock and, instead, sources products from a third-party manufacturer or wholesaler who holds the items and ships them as needed. The store owner pays the wholesale price as items are shipped, removing the burden of keeping their own inventory.
This is different from the 3PL model, where the store provides its own inventory to the third-party provider, and different from when a store stores its own inventory.
It makes sense for D2C businesses that own their own manufacturing and want to keep order fulfillment in house. It also makes sense for ecommerce businesses that want minimal involvement in the fulfillment process. Essentially, the business forwards shipping details to the manufacturer, who takes over the transaction.
The downside to dropshipping is that it means giving up control of the order process. Additionally, costs (and shipping times) can shoot up quickly when customers are far away from your manufacturing partner’s shipping locations.
Hybrid order fulfillment
Hybrid order fulfillment is any scenario that combines multiple strategies. For example, a company with heavy seasonal sales might keep most order fulfillment in house, but outsource some to a third-party firm during Q4. Alternatively, the company may select high-value or specialty items for dropshipping, while everything else is handled another way.
10 Best practices and tips for an optimized order fulfillment process
Once you’ve determined a broad direction for your order fulfillment strategy (or identified some top-tier issues with your current process), it’s time to reevaluate and optimize. Use these best practices and tips to tighten up your order fulfillment strategy and further wow your customer base.
1) Streamline receiving processes so damaged goods are handled promptly
Returns handling is something no business wants to focus on, but it’s an important area nonetheless.
Assess all incoming products before they’re sent to your inventory and set a process to separate and catalog those damaged goods. All damaged items should be documented so you can provide proof to the wholesaler or manufacturer of defective items.
Return damaged goods as soon as possible so you can get replacements and not slow down your order fulfillment. The last thing you want is to find a product that is damaged just as you’re packing it for shipment and be left scrambling.
{{lead-magnet-1}}
2) Organize your inventory and warehouse with efficiency in mind
If you’re handling your own inventory management and doing in-house fulfillment, keeping your inventory and warehouse organized can have a meaningful impact on your bottom line. When used in combination with an order fulfillment system, better organization can generate real results.
Searching for lost pallets is a resource drain that generates zero revenue. The right organizational strategy makes it easier for human or automated pickers to find the items, and can even reduce travel time between items. This is especially true as you scale organizational strategies across entire or multiple distribution centers — clear organization helps improve pick and pack times.
Even for small businesses, which may involve keeping inventory in a garage or office, it’s still important to have an organizational system in place. Simple tools like labels and a spreadsheet can go a long way.
Using a 3PL like ShipBob makes this all easier by taking inventory out of your hands, leaving you to focus on branding and customer service.
📚Recommended reading: An Essential Guide to Ecommerce Inventory Management
3) Automate processes wherever possible
Automation in warehousing settings requires substantial upfront investment and may even require rethinking your entire warehouse footprint. But wherever you’re able to implement it, automation can help save you money and time in the long run by optimizing labor, improving working conditions, and making operations safer.
Automation can happen in small ways, too. Using Gorgias and the apps that integrate into the helpdesk puts all your data into one place and makes it easier and faster to make decisions.
Adding an app like Alloy Automation makes your Gorgias admin even more efficient by pulling in tickets, daily shipments, survey data, and review information.
📚Recommended reading: Automate and Streamline Ecommerce Tasks While Keeping a Human Touch
4) Use order fulfillment software that integrates with customer service software
As your company grows, you’ll eventually turn to some kind of order fulfillment software. When you do, choose one that integrates well with your chosen customer service software — you don’t want siloed information systems that can’t talk to each other.
When your fulfillment software integrates with your helpdesk, you can see fulfillment data while answering customer questions. So, if a customer asks about the status of their order, you don’t have to pull open a new tab and copy/paste things like tracking numbers and estimated delivery dates. All of that is already in your helpdesk, making it much faster to provide helpful, personalized answers.
 |
Source: NetSuite and Gorgias integration
NetSuite and ShipBob are two leaders in this category. The latter also offers some third-party logistics support.
Learn more about Gorgias’ multiple integration options.
5) Prioritize your inventory’s accuracy
From a customer’s perspective, which is worse? Seeing that an item is sold out before you order it, or ordering (and paying for) an item that’s listed as in stock, only to find out later that the item was not actually in stock?
Most customers would prefer the bad news upfront. Inventory inaccuracies create a host of customer frustrations that your business would surely prefer to avoid.
The math here is simple, even if the execution is complex: The more accurate your inventory, the more success you’ll have in delivering the right products on time.
Whether you’re using an in-house order fulfillment model or you’re relying on a 3PL partner’s distribution centers, using a warehouse management system is generally better than relying on manual data entry. This is certainly true as you grow or scale your ecommerce venture.
You also want to be sure to watch the right set of inventory management metrics, which can show you how well you’re doing at keeping an accurate inventory. These metrics will vary depending on your goals, but could include:
- Backorder rate (rate of unfulfilled orders due to items on backorder)
- Accuracy of forecast demand (compares on-hand quantity to the forecasted demand)
- Lost sales ratio (number of days a product is out of stock compared to projected sales over that time)
- Inventory shrinkage (inventory that you cannot find or cannot sell due to damage)
- Fill rate (measures how many items were shipped compared to ordered)
- Customer satisfaction score (number of positive responses against all responses)
If you’d like to learn more about these and other metrics, NetSuite has put together a solid explainer on 33 of the most important inventory management KPIs and metrics. Their guide explains all six of the metrics we’ve listed, plus several others.
6) Minimize package touching and handling
In general, it’s a good idea to limit the number of touches that each package gets (There are packing strategies that disregard this, such as wave picking, but we still consider it to be a best practice unless you have an overriding reason to choose a different strategy).
Why is it a good strategy to minimize touching and handling? Because of all the things that could potentially go wrong at every touch:
- Product damage
- Shrinkage
- Employee injury
- Packing mistakes (too many, not enough, or missing items)
Additionally, every touch is added time and energy expended on an item. You want to get items out the door with as little friction as possible, so engineer your processes in a way that minimizes touches and handoffs.
7) Keep enough inventory to keep up with demand
This best practice circles back to demand forecasting, which is always a complex element for ecommerce retailers. You want to keep enough inventory on hand to keep up with customer demand, because delivering on time and reducing stockouts are two primary ways to increase customer satisfaction.
Of course, you don’t want to overdo it and end up with excess or even dead inventory. Keep your inventory levels modest, yet sufficient — always have enough to deliver on time, but remain agile enough that you don’t end up with pallets upon pallets of product sitting around that cannot be sold.
Regularly assess your orders for what items are most popular and keep an eye on key calendar dates — like Black Friday and the holiday season — to predict how much inventory you’ll need.
8) Use an RFID system to enhance analytics
If you’re not relying on a third-party order fulfillment system and you’ve reached a certain size and complexity, consider implementing a radio-frequency identification (RFID) system for tracking inventory.
RFID is a technology that uses tags and a reader device to track inventory in an automated way. It’s a way of providing real-time tracking for your inventory. Learn more about RFID with this Luluemon case study:
https://youtu.be/cZfx2naKYXo
Such a system far outpaces traditional systems for tracking and managing inventory, and it unlocks additional levels of analytics that can give you a better understanding of your inventory.
When doing inventory at scale, better data means better decision-making, which can filter through all levels of your supply chain.
9) Be clear with your shipping options
Unless you offer pick-up or can deliver orders yourself, such as in a local delivery area, you’ll be relying on a shipping carrier such as USPS, FedEx, or Purolator.
Customers want clear shipping times and flexibility. Do your research to understand which shipping partner will best suit your needs and communicate their various options to your customers, who may be willing to pay more for shipping if it means a faster delivery time.
The same is true if you’re using a third-party fulfillment partner. Ensure they can meet your shipping expectations, keeping in mind the average customer expectation for online delivery is three days.
Another way to achieve this is with good coverage. Ideally, a fulfillment provider has enough warehouse locations to cover at least 95% of the US, for example.
Native Union, a tech accessory brand, lets customers input their shipping zip code to estimate the cost of each delivery option before they place an order:
 |
10) Make returns and edits a simple process
Your customers want a simple returns process, as do your in-house order fulfillment teams.
There’s strategic value in instituting a transparent returns process that’s easy for your customers to understand and use when they need it. Don’t forget about the back end, either. Your internal teams are just as important to your continued order fulfillment success, so make sure the process for handling returns is simple to execute.
Start by setting expectations for returns and exchanges ahead of time with a FAQ or Help Center page that clearly outlines your return and refund policies.
Then, streamline the returns process with the following recommendations:
Use self-service order management to let customers cancel orders and request returns
Make it as easy as possible for customers to initiate cancellations or request returns, saving time for both them and your customer service team.
Use Gorgias’ Automate to create a self-service portal that customers can use for these processes. Instead of waiting for an agent to help, customers can use the chat widget on your ecommerce website to:
- Track the status of their order
- Return an order
- Report issues
- Cancel an order
 |
For any ecommerce business, these are the top reasons customers reach out or file tickets, cluttering your dashboard. Letting customers take care of these processes themselves streamlines your workflow and builds customer satisfaction.
Use a tool like Loop to fully automate the returns and exchanges
Loop is a returns app that allows a customer to initiate a return or exchange all on their own without having to wait for your customer support team. With Loop, customers can see which of their items are available for return or exchange or select a new item or size for replacement.
Loop helps with customer retention by offering an exchange or bonus credit rather than an outright return, giving customers a chance to stay a customer. Loop then provides you with data so you can get insights into where customers may be running into issues with your products.
 |
And best of all, Loop fully integrates with Gorgias so you can see all those return and exchange details in one place. Read how Kulani Kinis saved $400,000 in refunds using Gorgias and Loop together.
📚Recommended reading: 10 Ways To Reduce Ecommerce Product Returns With Great CX
Enhance your ecommerce order fulfillment process and customer service with Gorgias
Ecommerce businesses benefit when they get intentional about their order fulfillment strategy. By leapfrogging past common hurdles like poor inventory management or poor shipping experiences, businesses can strengthen customer relationships and continue to grow.
The best practices and tips we’ve provided here can get you well on your way to improving your order fulfillment strategy. But in the end, you also need the right tools and apps to round out your inventory and customer service abilities.
Gorgias can transform how you empower your customer service team with better helpdesk and customer service tools tailored to the needs of ecommerce businesses.
Plus, Gorgias integrates with all the top ecommerce platforms, shipping and fulfillment software, and other ecommerce apps used by businesses like yours to simplify essential services like order management.
{{lead-magnet-2}}
Ready to find out how Gorgias can help improve your order fulfillment strategy? Sign up for free today!
Ecommerce KPIs: The Complete Guide to Metrics, Dashboards, and Benchmarks
TL;DR:
- Ecommerce KPIs are goal-driven metrics that track store performance across sales, marketing, customer service, operations, and finance.
- Not all metrics are KPIs. KPIs tie directly to business goals, while metrics are observational. Leading indicators predict future performance; lagging indicators report past results.
- Focus on 3-5 KPIs per goal, mapped to specific funnel stages (awareness, consideration, conversion, retention, advocacy). Tracking everything leads to analysis paralysis.
- Centralized dashboards matter. Use tools like GA4, Looker Studio, and data warehouses to monitor KPIs without jumping between platforms.
- Review cadence varies by KPI. Check high-volatility metrics (traffic, ROAS) weekly, campaign metrics (AOV, CAC) monthly, and strategic metrics (CLV, NPS) quarterly.
Ecommerce KPIs are quantifiable metrics that measure how well your store performs against specific business goals, tying directly to revenue, margin, and operational efficiency. The main challenge is choosing the right ones, as many brands track too many metrics and lose sight of what actually moves the business forward.
This guide breaks down the KPIs that matter across sales, marketing, customer service, operations, and finance. You'll learn how to select KPIs based on your goals, map them to funnel stages, set up dashboards, and establish review cadences that keep your team accountable.
What are ecommerce KPIs?
A KPI (key performance indicator) is a goal-driven metric that measures progress toward a specific business objective. It's not just a number you track - it's a number tied to a decision or action.
A metric, by contrast, is any measurable data point. It provides context but doesn't necessarily connect to a goal. Website traffic is a metric. It becomes a KPI when you set a target (e.g., increase traffic by 30% in Q2) and use it to inform marketing spend decisions.
KPIs also fall into two categories: leading indicators predict future performance, while lagging indicators report what already happened. Cart abandonment rate is a leading indicator - it signals potential revenue loss before it hits your bottom line. Monthly revenue is a lagging indicator - it tells you what you earned after the fact.
Example: Conversion rate is a KPI when tied to a revenue goal. Website traffic is a metric until you set a target and use it to measure marketing effectiveness.
KPIs vs metrics (and leading vs lagging)
KPIs are goal-driven. Metrics are observational. A metric becomes a KPI when you assign it a target, connect it to a business outcome, and use it to drive decisions.
Leading indicators are predictive. They help you anticipate problems or opportunities before they affect revenue. Lagging indicators are historical. They confirm what already happened and validate whether past strategies worked.
Examples:
- Leading KPI: Cart abandonment rate (predicts future revenue loss)
- Lagging KPI: Monthly revenue (reports past performance)
- Metric: Page views (observational data without a target)
- KPI: Page views with a 25% growth target tied to SEO investment
Why ecommerce KPIs matter (for revenue, margin, and CX)
KPIs drive alignment across teams. When marketing, customer service, and operations all work toward the same goals, decisions happen faster and resources get allocated more effectively.
They also enable forecasting. Leading indicators like cart abandonment rate or email click-through rate help you predict revenue trends before they show up in monthly reports. This gives you time to adjust tactics before problems compound.
Finally, KPIs create accountability. When everyone knows which metrics matter and who owns them, progress becomes measurable. You stop relying on gut instinct and start making decisions based on evidence.
The business impact breaks down into three areas:
- Alignment: Everyone works toward the same goals instead of optimizing for their own department metrics.
- Forecasting: Predict future performance based on trends in leading indicators, giving you time to course-correct.
- Accountability: Clear ownership and progress tracking means no one can hide behind vague claims about effort or activity.
{{lead-magnet-1}}
How to choose the right ecommerce KPIs
Start with SMART goals (Specific, Measurable, Achievable, Relevant, Time-bound). Actionable KPIs come from specific, time-bound goals. For example, a goal to "increase repeat purchases by 20% in Q2" is more effective than a vague goal to "grow revenue." Once you've defined goals, map them to funnel stages (awareness, consideration, conversion, retention, advocacy). This ensures you're measuring the right thing at the right time. A retention goal should rely on retention-focused metrics, while awareness goals should use awareness-focused metrics.
Follow these steps:
- Define goals: Increase repeat purchases by 20% in Q2
- Map to funnel stage: Retention
- Select KPIs: Repeat purchase rate, customer lifetime value (CLV), churn rate
- Set targets: Repeat purchase rate >30%, CLV >USD$500, churn
Select three to five KPIs per goal.
Example: Goal: Increase repeat purchases by 20% -> KPI: Repeat purchase rate -> Target: 30% by end of Q2.
Map KPIs to goals and stages
Funnel stages determine which KPIs matter most. A brand focused on building awareness shouldn't obsess over CLV. A mature brand with strong repeat purchase rates should prioritize retention over acquisition.
Map KPIs to funnel stages like this:
- Awareness: Impressions, reach, social followers
- Consideration: Traffic sources, cost per acquisition (CPA), email click-through rate (CTR)
- Conversion: Conversion rate, cart abandonment rate, average order value (AOV)
- Retention: Repeat purchase rate, CLV, churn rate
- Advocacy: Net promoter score (NPS), referral rate, review count
Example: Goal: Increase repeat purchases -> Funnel stage: Retention -> KPI: Repeat purchase rate -> Target: 30% by Q2.
How often to review KPIs (weekly, monthly, quarterly)
Review cadence depends on volatility and actionability. High-volatility metrics need frequent monitoring. Strategic metrics that change slowly can be reviewed less often.
Weekly reviews work for metrics you can act on immediately:
- Traffic (by source and channel)
- Return on ad spend (ROAS)
- Cart abandonment rate
- First response time (FRT)
Monthly reviews work for campaign-level metrics:
- AOV
- Customer acquisition cost (CAC)
- Email CTR and open rate
- Conversion rate
Quarterly reviews work for strategic, slow-moving metrics:
- CLV
- Churn rate
- NPS
- Gross margin
Exception: During high-stakes periods like BFCM, monitor daily. Volatility spikes and the cost of delayed action increases dramatically.
The ecommerce funnel for KPIs
The ecommerce funnel breaks the path to purchase into five phases: awareness, consideration, conversion, retention, and advocacy.
KPIs at the top of the funnel (awareness, consideration) focus on reach and traffic quality. Middle-funnel KPIs (conversion) measure how effectively you turn visitors into customers. Bottom-funnel KPIs (retention, advocacy) measure long-term value and brand loyalty.
The sections below preview the KPI categories we'll cover in detail later. For now, understand that effective KPI tracking requires mapping metrics to specific funnel stages, not just tracking everything and hoping patterns emerge.
Awareness and discovery
Awareness is about building brand visibility. At this stage, potential customers don't know you exist. Your goal is to get in front of them through organic search, paid ads, social media, or content marketing.
Example KPIs: Impressions, reach, social followers, branded search volume.
Consideration (acquisition)
Consideration is about driving qualified traffic to your store. Potential customers now know you exist. Your goal is to attract visitors who are likely to convert, not just inflate traffic numbers.
Example KPIs: Cost per acquisition (CPA), traffic sources (organic, paid, social, referral), email CTR.
Conversion
Conversion is about turning visitors into customers. This is where traffic quality meets site experience. Your goal is to reduce friction and make purchasing as straightforward as possible.
Example KPIs: Conversion rate, cart abandonment rate, AOV, add-to-cart rate.
Retention
Retention is about keeping customers engaged after their first purchase. Acquiring a new customer costs 5 to 25 times more than retaining an existing one, making retention critical for profitability.
Example KPIs: Repeat purchase rate, CLV, churn rate, customer retention rate.
Advocacy
Advocacy is about turning customers into promoters. At this stage, satisfied customers refer friends, leave positive reviews, and amplify your brand on social media.
Example KPIs: NPS, referral rate, review count, social mentions.
Ecommerce KPI index (by category and funnel)
Use this index as a quick reference for the KPIs covered in this guide. Each KPI is organized by category (sales, marketing, customer service, operations, finance) and mapped to its primary funnel stage.
Sales KPIs:
- Conversion rate (CR) (Conversion)
- Average order value (AOV) - Conversion
- Revenue per visitor (RPV) - Conversion
Marketing KPIs:
- Traffic sources and attribution - Consideration
- Engagement (bounce rate, time on site) - Consideration
- ROAS and CPA - Consideration
- Email CTR and open rate - Consideration
Customer service KPIs:
- CSAT and NPS - Retention, Advocacy
- First response time (FRT) and resolution time - Retention
- Hit rate and escalation rate - Retention
Operations and fulfillment KPIs:
- Order processing and delivery time - Conversion, Retention
- Inventory turns and stockouts - Conversion
- Return rate - Retention
Finance and profitability KPIs:
- Gross margin and COGS - All stages
- CAC and payback period - Consideration, Conversion
- CLV (LTV) - Retention
Sales KPIs
Sales KPIs measure how effectively you convert traffic into revenue. They focus on the conversion stage of the funnel but also impact retention through AOV and repeat purchase behavior.
These metrics directly tie to top-line revenue growth. Improving conversion rate means more customers from the same traffic. Increasing AOV means more revenue per transaction. Optimizing revenue per visitor (RPV) means better traffic quality and site experience combined.
Conversion rate (CR)
Conversion rate is the percentage of website visitors who complete a purchase. It's one of the most direct measures of site effectiveness and user experience quality.
Formula: (Total orders / Total sessions) x 100
Benchmark: One to three percent is the average across ecommerce. Fashion and beauty typically run lower (1-2%), while niche or high-intent categories can reach 3-5%.
Improving CR requires testing checkout flows, reducing friction, and ensuring product pages answer common objections. Small improvements compound - a 0.5% increase in CR can translate to significant revenue gains at scale.
Average order value (AOV)
Average order value is the average amount customers spend per transaction. It's a direct lever for revenue growth that doesn't require increasing traffic or conversion rate.
Formula: Total revenue / Total orders
Benchmark: Varies by category. Fashion averages USD$50-USD$100, electronics USD$200+, and home goods USD$100-USD$150.
Tactics to improve AOV include upselling (encouraging customers to buy a premium version), cross-selling (suggesting complementary products), bundling (offering product sets at a discount), and free shipping thresholds (e.g., free shipping on orders over $100).
Revenue per visitor (RPV) and orders
Revenue per visitor is the average revenue generated per site visitor. It combines conversion rate and AOV into a single metric that captures overall site effectiveness.
Formula: Total revenue / Total visitors
Benchmark: $1-5 typical for most ecommerce stores.
Improving RPV requires optimizing both traffic quality and conversion. Attracting high-intent visitors increases the likelihood of purchase. Improving site experience and reducing friction increases conversion. Upselling and cross-selling increase AOV. All three levers work together.
Marketing KPIs
Marketing KPIs measure acquisition efficiency. They focus on the awareness and consideration stages of the funnel, tracking how effectively you attract qualified traffic and convert marketing spend into revenue.
These metrics determine whether your marketing budget is working. High ROAS means every dollar spent generates meaningful returns. Low CPA means you're acquiring customers efficiently. Strong traffic attribution means you can double down on what works and cut what doesn't.
For example, the brand Revenge used in-store customer insights to shape ecommerce merchandising decisions, leading to strong online conversion rates and efficient ad spend.
Traffic sources and attribution
Traffic sources break down where visitors originate: organic search, paid ads, social media, referral links, or direct visits. Attribution models assign credit to the channels that influenced a purchase.
Attribution types:
- First-touch: Credits the first channel a customer encountered
- Last-touch: Credits the final channel before purchase
- Multi-touch: Distributes credit across all touchpoints in the journey
Understanding attribution helps you allocate budget to high-converting channels and test new acquisition tactics without flying blind.
Engagement (bounce rate and time on site)
Bounce rate is the percentage of visitors who leave after viewing a single page. Time on site is the average session duration. Both measure how effectively your site captures and holds attention.
Benchmarks: Bounce rate 2 minutes is good. Product pages should have lower bounce rates than blog content.
Improving engagement requires fast page loads, compelling content, clear navigation, and effective CTAs. If visitors bounce immediately, they're either not finding what they expected or the page fails to communicate value quickly enough.
ROAS and CPA
Return on ad spend (ROAS) measures revenue generated per dollar spent on ads. Cost per acquisition (CPA) measures the cost to acquire one customer. Together, they determine whether paid marketing is profitable.
ROAS formula: Revenue from ads / Cost of ads
CPA formula: Total marketing spend / New customers acquired
Benchmarks: ROAS >3:1 is generally sustainable. CPA should be
Improving these metrics requires optimizing ad creative, targeting the right audience, testing landing pages, and adjusting bidding strategies based on performance data.
Email CTR and open rate
Email click-through rate is the percentage of recipients who click a link in your email. Open rate is the percentage who open the email. Both measure how effectively your email marketing drives engagement and traffic.
Benchmarks: Open rate 15-25%, CTR 2-5% for promotional emails.
Improving email performance requires testing subject lines, segmenting lists based on behavior or purchase history, personalizing content, and optimizing send times. Batch-and-blast campaigns underperform targeted, segmented sends.
Customer service KPIs
Customer service KPIs measure how effectively your support team resolves issues and maintains customer satisfaction. These metrics directly impact retention, repeat purchase rates, and customer lifetime value.
Poor customer service drives churn. Fast, helpful support builds loyalty. The KPIs below help you identify bottlenecks, measure satisfaction, and ensure your team has the capacity to handle volume without sacrificing quality.
CSAT and NPS
Customer satisfaction score (CSAT) measures satisfaction following a support interaction. Net promoter score (NPS) measures likelihood to recommend your brand. Both capture different dimensions of customer sentiment.
CSAT is typically measured with a post-interaction survey: "How satisfied were you with this support experience?" Responses range from 1 (very unsatisfied) to 5 (very satisfied).
NPS is measured with a single question: "How likely are you to recommend us to a friend?" Responses range from 0-10. Scores 9-10 are promoters, 7-8 are passive, 0-6 are detractors. NPS = % promoters - % detractors.
Benchmarks: CSAT >80% is strong. NPS >50 is excellent for ecommerce.
Improving these scores requires gathering feedback to identify issues, training agents, and ensuring your team has the tools to resolve problems efficiently.

View your average customer satisfaction score and feedback in Gorgias's Statistics overview.
First response time and resolution time
First response time (FRT) measures how long it takes your team to initially respond to a customer inquiry. Resolution time (also called average resolution time, or ART) measures how long it takes to fully resolve the issue.
Benchmarks: FRT
Improving FRT and ART requires automation (using AI Agent or Macros to handle FAQs like "where is my order?"), better agent training, and tools like Gorgias that centralize tickets and streamline workflows.

You can view your first response time, satisfaction score, and more under Support Performance Statistics in Gorgias.
Hit rate and escalation rate
Hit rate is the percentage of inquiries resolved by first-line support without escalation. Escalation rate is the percentage requiring manager or specialist intervention. Both measure agent empowerment and knowledge base effectiveness.
Benchmarks: Hit rate >80% is strong. Escalation rate
Improving these metrics requires empowering agents with the authority to resolve issues, maintaining a robust knowledge base, and using AI Agent to deflect simple questions automatically. High escalation rates often signal gaps in training or overly restrictive policies.
Operations and fulfillment KPIs
Operations KPIs measure the efficiency of your supply chain, warehouse, and fulfillment processes. These metrics directly impact margin, customer satisfaction, and repeat purchase behavior.
Slow delivery times harm satisfaction. Stockouts kill conversion. High return rates erode margin. The KPIs below help you identify operational bottlenecks before they become customer-facing problems.
Order processing and delivery time
Order processing time measures how long it takes to pick, pack, and ship an order after it's placed. Delivery time measures how long it takes the carrier to deliver it to the customer.
Benchmarks: Processing
Improving processing time requires optimizing warehouse workflows, using warehouse management systems (WMS), and ensuring adequate staffing during peak periods. Improving delivery time requires partnering with faster carriers or using distributed fulfillment centers closer to customers.
Inventory turns and stockouts
Inventory turnover measures how often you sell and replace stock. It's a proxy for demand forecasting accuracy and capital efficiency. Stockout rate measures the percentage of time SKUs are unavailable.
Inventory turnover formula: COGS / Average inventory value
Benchmarks: 4-6 turns per year is typical for ecommerce. Stockout rate
Improving turnover requires better demand forecasting and avoiding overstocking slow-moving SKUs. Reducing stockouts requires safety stock buffers, diversified suppliers, and real-time inventory visibility across channels.
Return rate
Return rate is the percentage of orders customers return. High return rates erode margin through restocking costs, reverse logistics, and lost product value (if items can't be resold).
Formula: (Returns / Total orders) x 100
Benchmarks: 5-10% is average for most categories. Apparel runs higher (20-30%) due to fit and sizing issues.
Reducing return rates requires accurate product descriptions, detailed sizing guides, high-quality product photography, and quality control processes that catch defects before shipping.
Finance and profitability KPIs
Finance KPIs measure unit economics and long-term profitability. These metrics determine whether your business model is sustainable and whether growth is profitable or burning cash.
Strong gross margins provide room to invest in growth. Low CAC relative to CLV means customer acquisition is profitable. Short payback periods mean you recover marketing spend quickly and can reinvest in more growth.
Gross margin and COGS
Gross margin is revenue minus cost of goods sold (COGS), expressed as a percentage. COGS includes direct costs like product manufacturing, packaging, and shipping supplies. Gross margin determines how much is left to cover operating expenses and generate profit.
Formula: (Revenue - COGS) / Revenue x 100
Benchmark: 40-60% is typical for ecommerce. Digital products and services run higher. Physical products with complex supply chains run lower.
Improving gross margin requires negotiating supplier costs, reducing waste in production or fulfillment, optimizing pricing based on willingness to pay, and eliminating low-margin SKUs that don't contribute meaningfully to overall profitability.
CAC and payback period
Customer acquisition cost (CAC) is the total cost to acquire one customer, including ad spend, creative production, marketing team salaries, and tools. Payback period is the time required to recover CAC from customer revenue.
CAC formula: Total marketing spend / New customers acquired
Benchmarks: CAC should be
Improving CAC requires optimizing ad targeting and creative, emphasizing high-converting channels, and improving conversion rates so more traffic converts without increasing spend. Reducing payback period requires increasing AOV, driving repeat purchases faster, or improving retention.
CLV (LTV)
Customer lifetime value (CLV, also called LTV) is the total revenue expected from a customer over their entire relationship with your brand. It's one of the most important metrics for ecommerce profitability.
Formula: AOV x Purchase frequency x Customer lifespan
Benchmark: LTV:CAC ratio >3:1 is strong. Higher is better, but excessively high ratios may indicate underinvestment in growth.
Increasing CLV requires driving repeat purchases through loyalty programs, email marketing, and exceptional customer service. Increasing AOV through upselling and cross-selling also lifts CLV. Reducing churn extends customer lifespan, compounding the value of each acquisition.
Ecommerce KPI dashboard and measurement
Centralized dashboards consolidate KPIs in one place, eliminating the need to jump between tools. Without a dashboard, you rely on memory, spreadsheets, or stitching together reports from multiple platforms. This slows decision-making and increases the risk of missing trends.
A modern metrics stack includes Google Analytics 4 (GA4) for web analytics, Looker Studio for visualization, a data warehouse for centralized storage, and ELT (extract, load, transform) tools to move data between systems.
Together, these tools create a single source of truth for KPIs, accessible to everyone who needs it. Kenny Flowers used custom reports in Shopify analytics to track KPIs across sales channels, enabling faster decisions during peak periods.
Metrics stack (GA4, Looker Studio, data warehouse)
GA4 tracks website behavior, traffic sources, conversion events, and user journeys. It's the foundation for understanding how visitors interact with your site.
Looker Studio (formerly Google Data Studio) visualizes data from GA4, Shopify, and other sources. It turns raw data into charts and tables that make trends obvious at a glance.
Data warehouse (e.g., BigQuery, Snowflake) centralizes data from all sources - GA4, Shopify, email platforms, ad platforms, customer service tools. This enables cross-platform analysis and attribution modeling.
ELT tools (e.g., Fivetran, Stitch) automate data movement from source systems into your data warehouse. They eliminate manual exports and ensure dashboards stay up to date.
A semantic layer (e.g., dbt) sits on top of your warehouse, defining metrics in a consistent way so everyone uses the same definitions. This is critical for AI-ready data - LLMs need consistent schemas to generate accurate insights.
Building an ecommerce KPI dashboard
Building a dashboard starts with selecting 5-10 KPIs that align with your current goals. Don't try to visualize everything. Focus on the metrics that drive decisions.
Follow these steps:
- Select 5-10 KPIs based on your goals and funnel priorities.
- Connect data sources using ELT tools or native integrations (e.g., GA4 to Looker Studio).
- Design layout with the most important KPIs at the top. Use charts for trends and tables for detail.
- Set refresh cadence based on how often KPIs change (daily for traffic, weekly for conversion, monthly for CLV).
- Share with stakeholders and establish a regular review rhythm (weekly, monthly, or quarterly depending on the metric).
Clarity matters more than complexity. A dashboard with 50 metrics confuses more than it informs. Start small, iterate, and add KPIs as your team's analytical maturity grows.
The 30/60/90-day KPI rollout
Effective KPI tracking starts with clarity about what matters. Choose metrics that tie directly to business outcomes, map them to funnel stages, and build dashboards that make trends obvious.
Use this 30/60/90-day roadmap to implement KPI tracking:
30 days: Choose 3-5 KPIs per goal based on your current priorities. Set up a basic dashboard in Looker Studio or your ecommerce platform's native analytics. Establish baseline performance for each KPI.
60 days: Test improvements to the 2-3 KPIs with the biggest revenue or margin impact. Run A/B tests, adjust tactics, and measure results against your baseline. Refine your dashboard based on what you actually use.
90 days: Review progress against targets. Identify what worked, what didn't, and why. Refine your KPI selection based on what drove real decisions. Scale successful tactics and cut what didn't move the needle.
If you're looking for tools to improve customer service KPIs like CSAT, FRT, and resolution time, book a demo with Gorgias to see how automation and AI can help your team handle more volume without sacrificing quality.
{{lead-magnet-2}}

12 Customer Satisfaction Metrics to Track & Why CSAT Isn't Everything
Creating a unique and satisfying customer experience is a crucial objective for brands across all industries. You’re probably already aware that most customers (95%, according to a Microsoft study) rank customer experience as important when it comes to brand choice and brand loyalty.
Most brands rely on customer satisfaction scores (CSAT) as the go-to metric for evaluating the customer experience. However, the problem with CSAT is that it's a lagging indicator of customer sentiment. Customers give you a CSAT score after an interaction. So, if your CSAT is low, you've likely already frustrated a new or loyal customer by the time you realize there is a problem.
Thankfully, tracking additional customer satisfaction metrics can go a long way toward filling the gap and ensuring that you can keep a finger on the pulse of your customer base. Below, we'll explore the best customer satisfaction metrics to track so that you can optimize your customer support services and overall customer journey — before your customer loyalty takes a hit.
{{lead-magnet-1}}
12 customer satisfaction metrics to better understand sentiment
Along with CSAT and NPS, you can use numerous other metrics to gauge customer satisfaction. If you want to create a holistic picture of how happy customers are with your brand to inform your customer service management efforts, here are the 12 metrics that you should track and analyze.
1) Customer effort score (CES)
CES tells you how much effort your customers have to put in to get answers to their questions or resolve their support issues.
By tracking this metric, you can identify high-effort customer experiences like long wait times when customers contact your call center or confusing responses from your support team. This gives you a great starting point so that you can address these obstacles that are inevitably harming customer satisfaction.
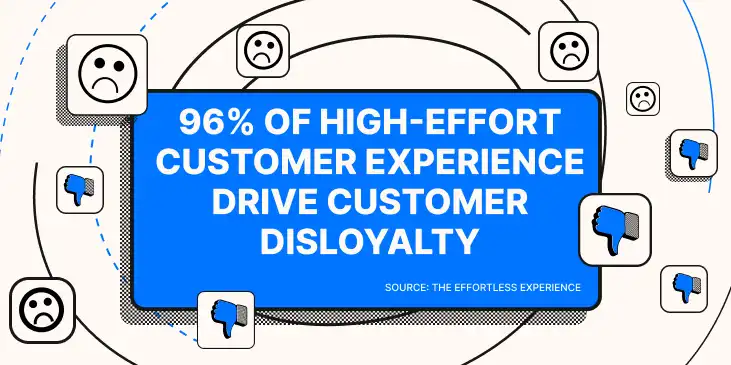
Customer effort is an extremely important indicator for the quality brand’s customer experience. Plus, it’s directly connected to your bottom line. 96% of high-effort experience drive customer disloyalty, according to The Effortless Experience.
Formula for calculating CES
To measure CES, you will need to send customers CES surveys. These surveys ask customers to rate on a scale of one to ten how much effort they had to exert to get an answer to their question. To calculate your overall CES score, you will need to divide the total sum of all responses by the total number of all responses.
CES = Total sum of responses / Total number of responses
2) Customer health score (CHS)
CHS is a metric largely employed by customer success teams to determine whether a customer is "healthy" or "at risk."
This enables customer success teams to identify customers who are at risk of leaving the company so that you can make efforts to retain them.
Unlike other customer satisfaction metrics, this metric is measured on a customer-by-customer basis rather than the average score of your entire customer base. This enables brands to utilize CHS to boost customer retention one customer at a time.
Formula for calculating CHS
There is no set formula for calculating CHS, and brands utilize a broad range of criteria to evaluate the health of individual customers. These criteria can also vary dramatically from industry to industry and even company to company.
But for ecommerce stores, here are a few important factors to consider when determining whether a customer is healthy or at risk:
- Customer survey results
- Contact rate with your support team
- Number of closed and open support tickets
- Social media involvement
- Email engagement rate
Especially for larger brands, we recommend creating a standard formula to measure customer health, and periodically measuring each customer (especially VIP customers) to proactively prevent customer churn.
3) Customer lifetime value (CLTV)
The primary point of reducing churn and improving customer loyalty is to increase your average customer lifetime value.
Attracting new customers is difficult and expensive, and when you succeed at bringing a new customer into the fold, you want them to spend as much money with your brand as possible.
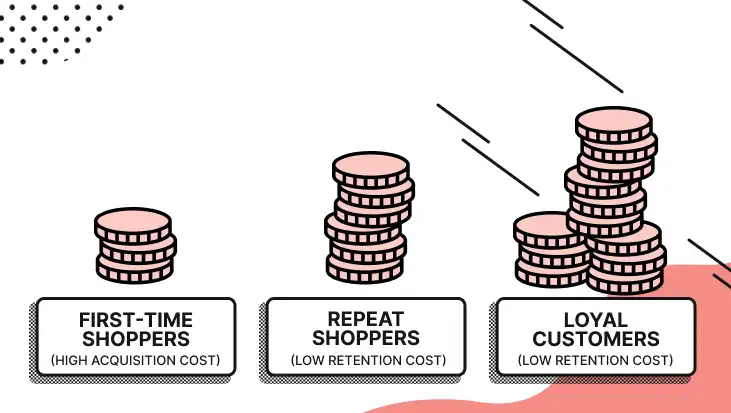
Lifetime value can indicate customer satisfaction because satisfied customers tend to spend more with companies they’re satisfied with. Continued spending and repeat purchases are a surer sign on satisfaction than any star rating could provide.
Formula for calculating CLTV
CLTV = Average purchase value x Average purchase frequency x Average customer lifespan
4) Customer churn rate (CCR)
Customer churn rate is the rate at which customers leave your company. For subscription-based online businesses, ecommerce churn rate is the rate at which people cancel subscriptions. For non-subscription-based companies, you can define churn as shoppers who fail to place a repeat order within some time frame (likely between one and six months, depending on your products and industry).
If your churn rate exceeds industry benchmarks, it almost certainly spells issues with your customer experience.
Reducing churn goes hand in hand with improving customer loyalty (and thus boosting revenue via higher customer lifetime values). If you can keep a handle on churn rate, you’ll have concrete evidence about how customer satisfaction is impacting your repeat business.
Formula for calculating CCR
CCR is calculated over a specific period. To calculate your churn rate for a given period of time, you can use this formula:
CCR = (Number of customers at the beginning of the time period - Number of customers at the end of the time period) / Number of customers at the beginning of the time period
5) Internal quality score (IQS)
IQS measures the quality of each of your support team's tickets, according to your own internal standards. For instance, you may define a good ticket as a ticket that resolves the customer's issues, reflects your brand voice and values, and is responded to promptly. A bad ticket might be any ticket that falls short of these standards.
If you’re like most brand, your IQS will revolve around four main elements:
- Speed: Did the agent respond within the terms of your service-level agreement (SLA)?
- Correctness: Did the agent’s response adhere to your company’s relevant policies?
- Helpfulness: Did the agent full address the customer’s question (and practice forward resolution)?
- Friendliness: Did the agent maintain a positive tone and use the powerful phrases that adhere to your company’s style guide?
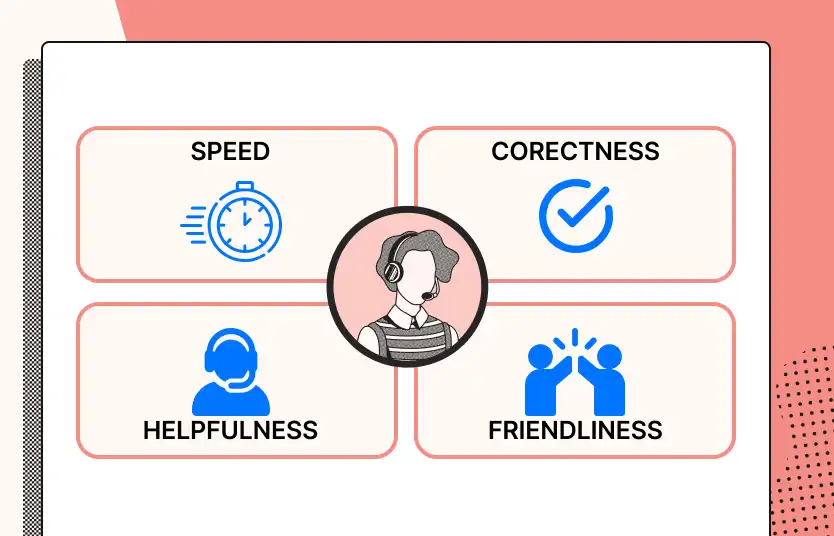
With an IQS, you can proactively identify where your customer support agents are currently improving satisfaction (or degrading it).
Formula for calculating IQS
We don’t have a clear calculation for IQS because each brand’s is different. However, we recommend using a simple rubric, where a ticket gets a point for meeting each item on the rubric.
This way, you can simply compare the quality of each ticket (or the average quality of each agent’s tickets). You’ll also get valuable information about the missing elements of each ticket, which can inform your customer service training.
6) First response time (FRT)
One thing that is sure to generate a lot of unhappy customers is making them wait a long time for answers to their questions. 90% of customers rate an immediate response as "important" or "very important" when they have a customer service question.
Therefore, attempting to reduce your FRT is one of the first steps to take on the road to optimizing customer satisfaction. This starts with tracking your average FRT and comparing it against industry benchmarks.
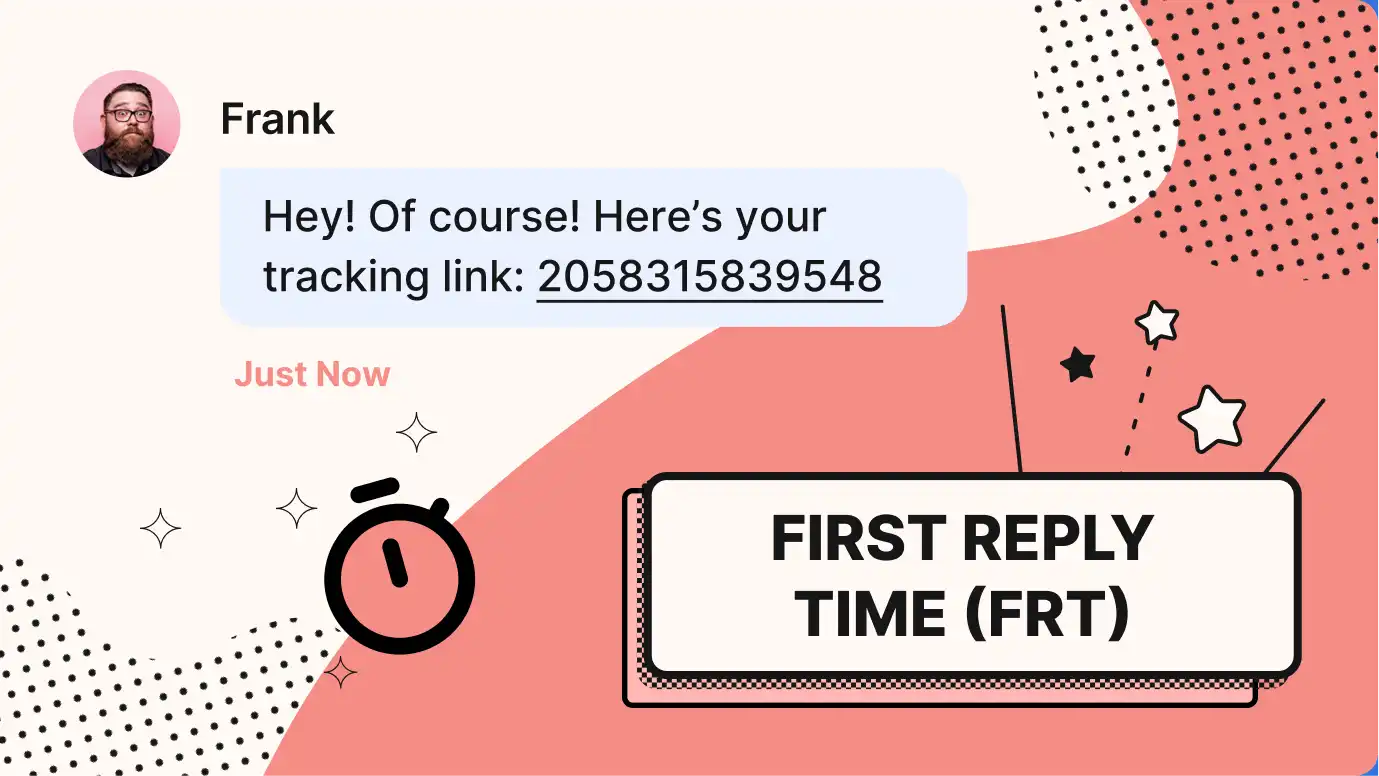
Formula for calculating FRT
Depending on your helpdesk, you may never need to manually calculate first-reply time. For example, with Gorgias, you get first-response time broken down by agent, time period, ticket type, and more:
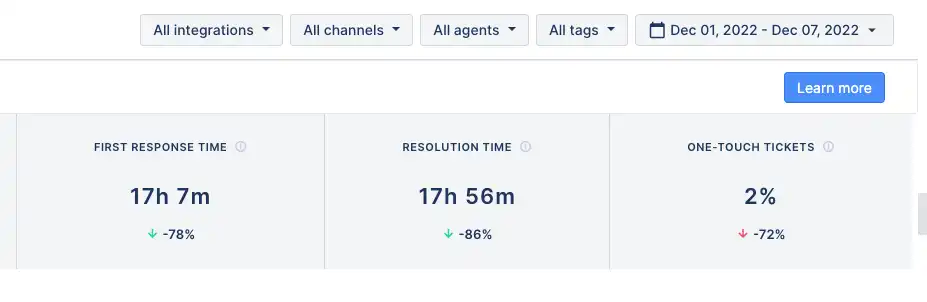
To calculate your support team's average FRT, you can use this formula:
FRT = Total first response times during the time period / Total number of resolved tickets during the time period
📚Recommended reading: 7 tips to improve your customer service response times.
7) Resolution time
It's important to respond to customer support tickets as fast as possible, but not all tickets can be resolved in a single response.
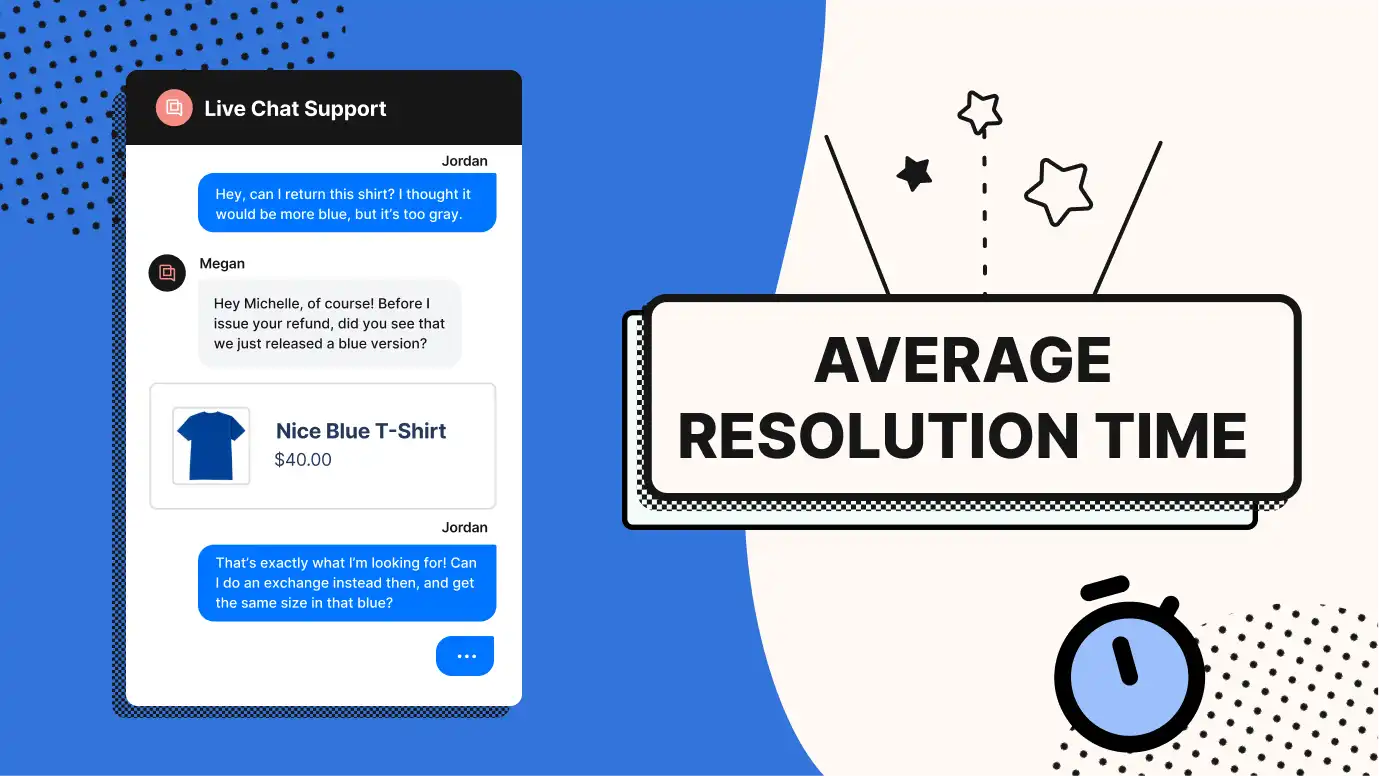
While customers who have received an initial response to their ticket tend to have a little more patience when waiting for a resolution, that patience will only stretch so far. This makes it important to calculate and improve your average resolution time and FRT.
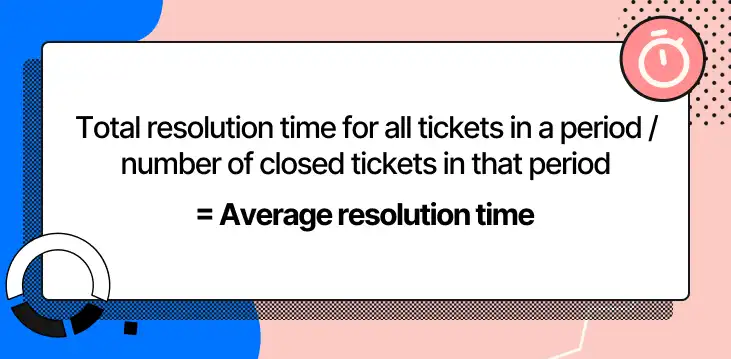
Formula for calculating resolution time
Just like first-response time, average resolution time isn’t normally something brands should spend time calculating. That’s why Gorgias users can see resolution time broken down by agent, time period, ticket type, and more:
Average resolution time = Total resolution times during the time period / Total number of resolved tickets during the time period
8) First-contact resolution
While it's true that you can't resolve every ticket with a single response, it's still a great objective for support teams to strive for. Resolving a customer's issue in a single response typically means that the customer received swift and satisfactory assistance that required minimal effort on their part. Therefore, working to boost your first-contact resolution rate is sure to improve customer satisfaction.
Formula for calculating first-contact resolution
To get an accurate evaluation of your first-contact resolution rate, you should only consider tickets that are possible to resolve in a single response. Once you've identified the criteria for tickets that are FCR-eligible, you can use this formula to calculate your FCR rate:
FCR = Number of support issues resolved on first contact / Total number of FCR-eligible support tickets
9) Self-service resolution rate
Enabling customers to resolve issues on their own without needing to contact your support team offers numerous benefits — like reducing agent workload and freeing them up to focus on more complex tickets.
Additionally, it provides customers with helpful self-service options, which improves customer satisfaction by ensuring that customers can quickly find the answers they need.
But to evaluate how effective your self-service options actually are, you'll need to track your self-service resolution rate. This metric tells you the rate at which customers can resolve issues on their own and can be used to gauge and improve the quality of your self-service resources, like your FAQ pages and Help Center.
Formula for calculating self-service resolution rate
Depending on your helpdesk, you may never need to manually calculate self-service resolution rate. With Gorgias, for example, you get detailed information about the usage of self-service resources on your site:

That said, you can calculate your self-service resolution rate using this formula:
Self-service resolution rate = Number of sessions that customers initiate with your brand's knowledge base or other self-help resources / Number of support tickets your support team handles over the same period of time
📚Interested in helping your customers help themselves for a low-effort experience? Check out our VP of Success's guide to customer self-service.
10) Support performance score
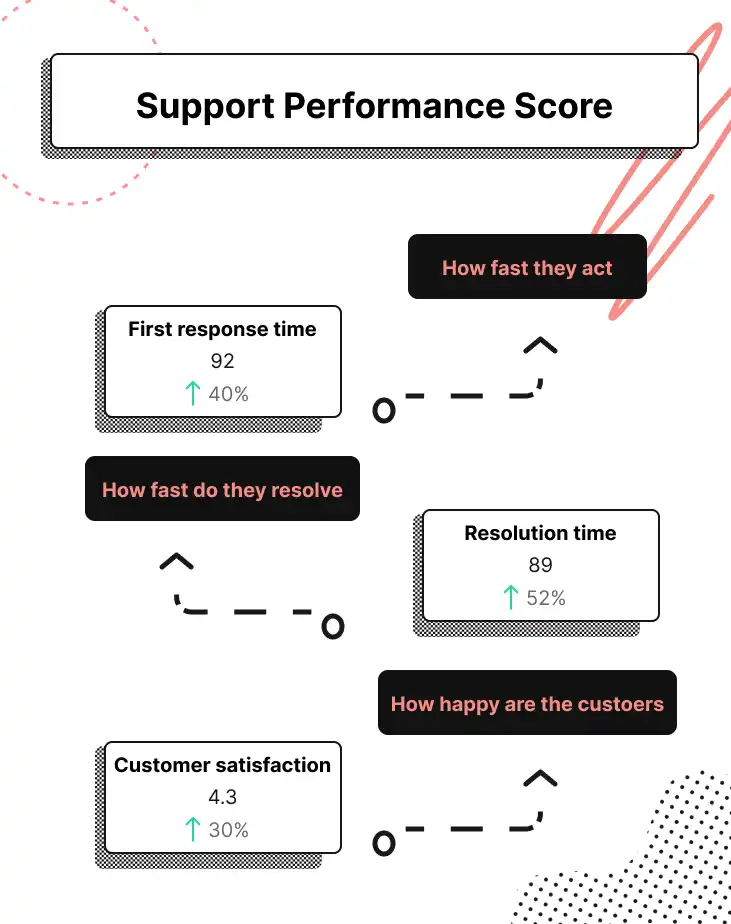
Support performance score (created by Gorgias) is a metric that encapsulates the three most important elements of great customer service: speed, helpfulness, and customer satisfaction.
To achieve this, the support performance score combines average first response time, average resolution time, and CSAT into a score that is on a scale of 1-5.
Tracking this metric provides support teams with a comprehensive overview of their performance quality.
Formula for calculating support performance score
Support performance score is calculated using a series of FRT, CSAT, and resolution time thresholds. To reach the next rating level, you must meet each category's threshold. Here is an example of what these thresholds look like for FRT:
- Level 1 (poor): 13+ hours
- Level 2 (lagging): 12 hours
- Level 3 (fair): 6 hours
- Level 4 (strong): 1 hour
- Level 5 (exceptional) 10 minutes
11) Customer satisfaction score (CSAT)
Customer satisfaction (CSAT) is the go-to customer support metric to understand customer sentiment around your brand and customer experience. Don’t get us wrong: We believe CSAT is one of the most important metrics. However, CSAT only gets measured after customers have a good or bad experience, making it a lagging indicator of customer sentiment.
You can determine your CSAT score using customer satisfaction surveys. The survey questions should ask customers to rate their satisfaction with your company by choosing from one of four responses: very unsatisfied, unsatisfied, neutral, satisfied, and very satisfied.
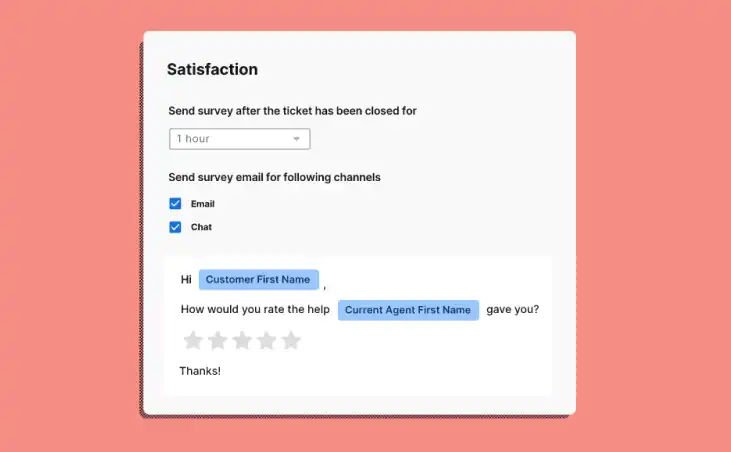
The ratio of customers who were either satisfied or very satisfied compared to the total number of customers who were unsatisfied or very unsatisfied is your brand's CSAT score.
While CSAT is certainly an important metric for ecommerce brands to measure and utilize, it isn't the end-all, be-all of tracking customer satisfaction. Brands that only track CSAT can encounter several limitations that can make it difficult to turn customer satisfaction results into business growth.
12) Net promoter score (NPS)
Net promoter score (NPS) is a metric that tells you how likely customers are to recommend your brand to friends, family members, and colleagues. If you want to improve your word-of-mouth advertising and start generating more referrals, NPS is the metric you will need to optimize.
Your NPS score can also provide insight into the overall satisfaction of your customer base.
For one, NPS isn't quite as subjective and one-dimensional as CSAT, since it asks customers to rate their willingness to recommend your company on a scale of 0-10 rather than asking them a single question about their satisfaction.
NPS is also more a measure of a customer's long-term satisfaction with your company, while CSAT surveys typically gauge a customer's short-term satisfaction with your product or service.
How to calculate NPS
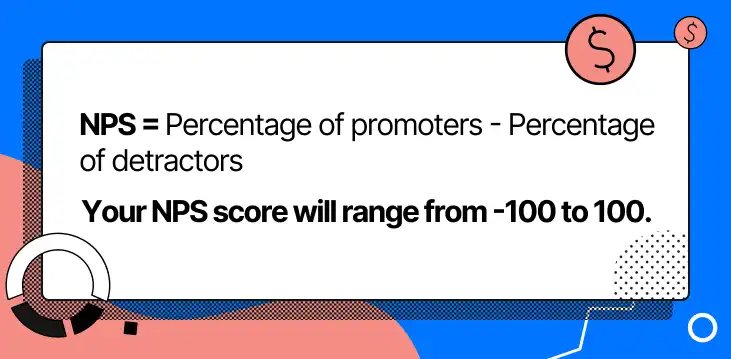
NPS surveys gather feedback on how likely customers are to recommend your brand on a scale of 0-10. Customers who rate you at 0-6 are considered detractors; customers who rate 7-8 are passives, and customers who rate 9-10 are your promoters.
To calculate NPS, you will need to calculate your promoters and detractors as percentages of your total number of survey responses. Then, subtract the percentage of detractors from the percentage of promoters.
So, if you got 100 responses with 40 promoters and 30 detractors (the rest being passives), here's what your calculation would look like:
NPS = 40% promoters - 30% detractors
NPS = 10
Why CSAT isn't the only metric you need to measure customer satisfaction
CSAT is a vital benchmark for analyzing your brand's number of satisfied customers. However, here are the three most important reasons why CSAT alone is not enough:
CSAT is a lagging indicator
We've already mentioned that the CSAT score doesn't indicate an issue with the overall experience at your company until it's already too late, when you've already provided a poor experience to customers.
This is an especially pressing issue when you consider that nearly a quarter of customers will switch to a competitor after a bad experience. Their CSAT results can help you improve the experience for future customers — but ideally, you don’t have to lose customers to get this information.
Ideally, your set of metrics to understand customer satisfaction include ones that don't require angry customers to tell you that your customer experience could be improved.
CSAT varies by industry
A CSAT score doesn't mean the same thing across every ecommerce vertical. According to Gorgias data, CSAT scores across 14 ecommerce verticals at the same revenue level ($10M GMV) vary by just 0.2 points on a 5-point scale, making it one of the least differentiated support metrics of all.
For comparison, first response time varies by 5.5x across those same verticals. In other words, CSAT is remarkably flat regardless of how fast or slow a brand actually responds to customers.
That makes it a poor signal for benchmarking your support operation against competitors in your space. A Health & Beauty brand and a Hardware brand could post nearly identical CSAT scores while operating very differently, and CSAT alone would never surface that gap.
CSAT is one-dimensional
CSAT tells you the ratio of customers who are satisfied with your brand compared to the number of unhappy customers, but it doesn't tell you anything about why your customer satisfaction levels are what they are.
Most CSAT surveys have a comment box, but customers rarely take the time to fill these out — especially with any meaningful level of detail.
A more well-rounded collection of metrics will help you better pinpoint the reason for high or low satisfaction, without solely depending on an optional comment box.
CSAT is subjective
Asking customers a single question about whether they are satisfied with their experience will yield highly subjective responses.
For instance, a specific issue might cause one customer to state they are "very unsatisfied," while the same issue might prompt another customer to respond with "neutral."
Plus, customers may complete the survey while annoyed, emotional, or tired — all of which could inflate (or minimze) the importance of an issue, skewing the insights.
For these reasons, CSAT offers the most value when used in tandem with other important customer satisfaction metrics — and the first of these important metrics is net promoter score (NPS).
How to improve customer satisfaction by collecting (and using) customer feedback
Metrics such as CSAT, NPS, and CES are all forms of customer feedback that ecommerce merchants can use to improve customer satisfaction. But along with tracking these metrics, gathering more in-depth customer feedback can be highly helpful for informing your customer satisfaction efforts.
A few of the ways that ecommerce brands can go about collecting and utilizing valuable customer feedback include:
- Audit low-scoring tickets to look for themes.
- Reach out to low-scoring customers for in-depth feedback.
- Reduce ticket volume with automation and self-service to free agents to solve complex tickets.
- Activate instant messaging channels like SMS and live chat.
📚Recommended reading: Our Director of Support’s guide to implementing customer feedback into your product and customer experience.
{{lead-magnet-2}}
Analyze customer satisfaction from all angles with Gorgias' dashboards
There are numerous metrics that support teams need to track to evaluate and improve customer satisfaction. Thankfully, Gorgias' best-in-class customer support platform makes tracking these metrics easier than ever before. With Gorgias' dashboards, you can:
- Automatically track key support performance metrics such as FTR and resolution rate
- Access revenue statistics to see how customer support is impacting your company's bottom line
- Live statistics that allow you to monitor agent performance in real-time
- Send customers automated customer satisfaction surveys
To get started utilizing these powerful tools to track and improve customer satisfaction, sign up for Gorgias today!

11 Ecommerce Pop-Up Types & Examples, Plus Benefits and Top Apps
We reviewed 300 Shopify store owners and discovered that 50% used website pop-ups as their preferred customer engagement tool. This isn’t surprising since pop-ups can yield a conversion rate of between 3% and 11%, compared to the standard rate of around 2%.
But using pop-ups to get more conversions for your website requires more than just slapping a newsletter email signup pop-up window on your website. In fact, poor use of pop-ups can drive customers away.
High-converting pop-ups are built on some of the best apps and tick all the boxes on our pop-up checklist. Below, we’ll dive deeper into this checklist and provide you with our top picks for pop-up app software.
{{lead-magnet-1}}
11 ecommerce pop-up types and examples
If you spend any time on the internet, you’ve likely encountered a pop-up campaign at some point. You may have even seen one on your journey to this page!
Pop-ups have come a long way over the last decade. Whereas they used to be aggressive annoyances, they are now significantly subtler and operate as invaluable sales and marketing tools.
Here are some of the most popular types of pop-ups to consider using for your store with ecommerce pop-up examples for each.
📚 Read more: 13 Ecommerce Growth Tactics to Boost Revenue
1) Sign-up form pop-ups
Depending on your current digital marketing strategy, sign-ups can be useful for a number of goals. You can invite visitors to sign up for a newsletter, register for an event, or receive an exclusive discount.
This lets you collect valuable customer information like email addresses and phone numbers that can be used for marketing efforts.
Offering something like a discount in exchange for an email subscription sign up is known as a “lead magnet.”
Example of a sign-up form pop-up
When customers visit swimwear brand Kulani Kinis ecommerce store, the first pop-up they see is a sign-up form. It also includes an enticing offer of a discount on a customer’s first order. And it’s all done with cute graphics that match Kulani Kinis’ branding.
Also note that the pop-up includes a line that says “By signing up you agree to receive email marketing.” This is required to comply with email marketing laws.

{{lead-magnet-2}}
2) Special offers and discounts
Those glossy pop-ups that appear and, for example, offer free shipping for orders over $xx or highlight a sale.
These can be tailored to just about any offering your ecommerce brand wants to promote, and can even be turned into a game to attract more interest.
Spin-the-wheel pop-ups that allow customers to “spin” to unlock their discount percentage is a fun way to interact with customers, and many enjoy the gamified experience.
You could also offer a post-purchase discount by offering one in exchange for a customer review on social media.
Example of an offer or discount pop-up
When shoppers visit Bagallery, they’re greeted by a large pop-up promoting an up to 60% discount and a link to “shop now.”

3) Exit pop-ups
If you’ve ever visited an ecommerce store and moved your mouse to navigate to another tab, you may have seen one of these pop-ups.
Exit pop-ups trigger when customers try to leave your website or have left the tab idling and are a great way to grab a customer’s attention and convince them to go to checkout.
It’s smart to offer an incentive to stay, like a discount code if they follow through on the purchase. The goal here is to reduce cart abandonment.
Example of an exit pop-up
This is the pop-up that appears on Princess Polly, a women’s apparel ecommerce store.
It’s triggered when a potential customer has added items to their shopping cart but left them sitting. The pop-up entices those customers with 10% off if they follow through with the purchase.

4) Seasonal pop-ups
Around seasonal shopping holidays, you may have targeted products or categories you’re looking to highlight to customers.
A pop-up can be a great way to draw attention to those products. A great example would be gift sets or stocking stuffer ideas during the Christmas season, or spooky items around Halloween. This pop-up type helps customers find what they need faster.
These can also create a sense of urgency by promoting a limited-time deal that coincides with a holiday.
Example of a seasonal pop-up
Here’s an example from skincare brand Absolute Collagen. It appears once the customer has scrolled down the main landing page a bit and reminds them that the “countdown to Christmas is on.”
Clicking through brings customers to Absolute Collagen’s curated gift sets, which is exactly what a customer might be looking for just before Christmas.

5) Upsell pop-ups
Upsell pop-ups suggest additional products a customer may want to add to their cart based on what they’ve already added. It typically pop ups right after an item has been added to the cart.
It’s important that these pop-ups are related to what customers have already been shopping for. It just doesn’t make sense, for example, to suggest purchasing a piece of cookware to someone who just bought a beauty product.
Product value also plays a role. If someone has just added a $25 product to their cart, it’s unlikely you can upsell them on a $100 product. The upsell product should be a cheaper product related to their original product choice.
Example of an upsell pop-up
Uqora is an ecommerce store that sells over-the-counter products for urinary health, targeted at women.
After adding their “Flush” product, shoppers get a pop-up suggesting their pH-balanced vulva cleanser for $10. This is a great example because the upsell product is inexpensive and targets site visitors already showing interest in health products.

📚 Read more: 11 Best Practices for Ecommerce Upselling
6) Chat campaigns
An unobtrusive chat pop-up tells shoppers that customer service is ready and waiting for their questions or concerns.
We’ll dig more into chat pop-ups later on, but they can be used for more than just offering help. They can be a spot to offer discounts, promote sales or products, or act as a personal stylist.
Example of a chat pop-up
Jewelry brand Jaxxon uses a chat pop-up to offer customer service as well as styling advice.
Powered by Gorgias, Jaxxon’s chat pop-up appears subtly in the bottom right corner of premium product pages, offering unique styling services. This is just one example of how you can use chat campaigns to spark conversation and increase conversions:

7) New arrivals pop-ups
When you launch a new product, a pop-up is a great way to get some eyeballs on it.
These pop-ups are especially important for your loyal, returning visitors to show them something new and exciting.
Example of a new product pop-up
This is a pop-up that appears on the homepage of Lillie Q, a BBQ sauce brand. It highlights their new tender sauces and also includes a button to see other new releases.

8) Local currency redirect pop-ups
Customers will always prefer to shop in their local currency, if available. According to Shopify, 17% of shoppers will abandon a cart if they can’t determine the total cost up front. Having to convert currencies makes it more difficult to determine that cost.
If your ecommerce store is equipped to offer local currency prices, or has multiple sites to offer a localized experience, a pop-up can redirect international customers.
Example of a local currency redirect pop-up
Crossnet is a sports equipment ecommerce store based in the US. However, when a customer visits from Canada they get a pop-up directing them to shop from the Canadian store in Canadian dollars.
This pop-up appears as soon as a Canadian customer visits, so their entire shopping experience can be in local currency.

📚 Read more: Reduce and Recover Shopify Cart Abandonment: 17 Tips & Tools
9) Loyalty program pop-ups
If you have an active loyalty program for your ecommerce store that earns customers points or other perks, a pop-up can prompt them to sign up.
Having a loyalty pop-up come up early tells customers before they even make a purchase that they’ll earn something when they do convert. This is another opportunity to capture email subscribers for email marketing campaigns.
Example of a loyalty program pop-up
Campus Protein is a supplement ecommerce store targeted at college students. When first visiting the site, a pop-up appears in the bottom left corner prompting new visitors to join their loyalty program and “unlock rewards.”
Clicking through takes customers to a page to create an account on the site and start earning Campus Protein points.

10) Giveaway pop-ups
A giveaway or other offer can pull double duty. First, they entice customers to stay on the site, similar to an exit pop-up. They’re also another way to collect information such as emails.
These are best employed after a potential customer has already been on the site for some time, as a way to keep them browsing.
Example of a giveaway pop-up
This is an example from Darn Good Yarn, an ecommerce store that specializes in ethically-sourced fiber.
It triggers when the site senses a potential customer is going to leave and offers a chance to win a $250 gift card. Not only is the offer enticing, but it’s an opportunity to collect emails for marketing.

11) Bundle pop-ups
This is a type of upsell that recommends bundling an item added to a customer’s cart with other products to create a discounted bundle. This is useful if you have products that can be worn or used together.
It’s an opportunity to add another product to a customer’s cart but also give a styling or utilization recommendation. It’s also a more customized type of pop-up because the product recommendation is directly related to something the customer already wants to purchase.
Example of a bundle pop-up
On the Jaxxon website, there are products in similar styles that look great when worn together.
In this case, when a customer adds the Cuban Link Bracelet to their cart, the pop-up recommends upgrading to the Cuban Essentials Set, which includes a matching necklace, at a discounted price.

Risks of pop-ups in ecommerce
Pop-ups have a ton of uses and are a proven conversion tool, so the temptation is there to use them as much as possible. However, that would be a huge mistake.
Pop-ups are only useful if they’re used smartly, sparingly, and with purpose.
The short-term conversion win will be harmed if they’re overused, hurting:
- Brand image
- Repeat business and loyalty
- Site performance
It’s vital that your pop-up choices do more harm than good so here are some of the risks of employing a pop-up strategy.

Pop-ups annoy customers
This might seem obvious but it can’t be understated: Customers simply aren’t fans of pop-ups. There’s a reason ad and pop-up blockers are popular browser add-ons.
Even with your best intentions, pop-ups interrupt the shopping experience. If a customer came to your ecommerce website looking for a particular product or just to browse, their first choice is not to have that experience intruded upon by a pop-up.
G2 conducted a poll and found that an overwhelming 82% of customers said they “hate” pop-ups asking with an email capture. In particular, 45.6% said they dislike how pop-ups seem to be “everywhere” and 28.6% disliked how they appear right away.
While 72% said there was nothing that makes pop-ups better, 11.9% said a discount offer helps reduce their displeasure.
Pop-ups can harm load speed
Adding pop-ups to your ecommerce site usually means adding additional apps or other tech, which can impact how quickly your site loads. Each additional pop-up can mean a slower load speed and higher bounce rate.
Load speed is a vital part of your ecommerce website. Data from Portent shows that conversion rates are highest at a 1-second load time and drop from there. Ecommerce retailers should aim for a load time of between 1 and 4 seconds, more than that seriously hurts conversion.
Plus, according to Unbounce, 45.4% of shoppers are less likely to make a purchase if the site loads slowly, and 36.8% are less likely to return to that ecommerce store.
Pop-ups can hurt your SEO strategy
Customers aren’t too fond of pop-ups, and neither is Google.
Since at least 2016, Google has been penalizing the most intrusive types of pop-ups, especially for users on mobile. In particular, Google doesn’t like pop-ups that appear right away and fill the whole screen and need to be closed before the website can be accessed.
That doesn’t mean pop-ups are a complete no-go. You can appease Google by:
- Disabling pop-ups on mobile
- Having a delay before pop-ups appear
- Keep pop-ups small an unobtrusive
- Disable pop-ups for customers coming in through Google search results
📚 Recommended reading: Our guide to Shopify search engine optimization (SEO).
Pop-ups can overlap
If a single pop-up can turn off a potential customer, several overlapping pop-ups is much worse.
In addition to the load time issues, competing pop-ups is just a bad user experience. There are more pop-ups than ever now when you consider prompts to accept cookies or other privacy provisions and browser pop-ups like requests to allow notifications.
This is compounded when a customer is on mobile, because there’s even less space and a higher likelihood of overlap.
Be mindful of what pop-ups are showing up by default and time pop-ups so only one is appearing at any one time.
Ecommerce pop-up best practices checklist
At the most basic level, a pop-up provides a call-to-action that entices potential customers. The right type of pop-up can increase your ecommerce store’s conversion rate, but this is only possible if you check off all six items on the checklist below.
1) Entice buyers with a value add
The offer you present in your pop-up should be useful to your target buyers. But the only way for you to create the right offer is to truly get to know who your buyers are and what interests them.
Say you create a pop-up to collect email addresses from web visitors. If the pop-up doesn’t have an incentive, there’s no “what’s in it for me?” for the target buyer.
We’d recommend modifying pop-up to present the buyer with a chance to win something. Providing a clearer incentive for customers is a much better way to improve the conversion rate of your pop-up.
📚 Read more: Ecommerce CRO: Increase Conversion Rate with A/B Testing and Optimization
2) Keep pop-ups short and sweet (like these pop-up examples)
The wording of your pop-up copy depends on both your offer and the type of pop-up you‘re using (exit pop-up, sales pop-up, discount pop-up, etc.). Regardless of the type of pop-up you use, it should follow what we call the SIP rule: short, impactful, and precise.
Here’s a fun example from United By Blue, a Shopify store that sells clothing and accessories. The pop-up is a wheel you can spin to get a special offer.

We received a 15% off offer after spinning the wheel, but take a closer look at the wording on this pop-up.

The headline makes the offer clear:
- The website visitor can then choose men’s clothing, women’s clothing, or both. Giving website visitors this choice helps with audience segmentation so that future offers are relevant to the user.
- There’s a prompt to input an email address which is followed by a clear CTA that once again reminds the website visitor of the precise offer.
Here’s another example from BLK & Bold, a Shopify store that sells specialty coffee.

- The headline clearly states the value of the offer — a 15% discount on the buyer’s first order.
- The short text that follows further explains the value of signing up for their email list — the buyer will receive exclusive offers via email.
Short. Impactful. Precise.
Note: Your pop-ups should always provide a clear option for people to opt in to receive newsletters and promotional emails from your brand. Otherwise, you run the risk of breaching data protection laws such as the GDPR.
3) Create a compelling image
The team at Drip analyzed over 1 billion pop-ups and discovered that pop-ups with images convert better than pop-ups without images by 83.57%. Images used for online store pop-ups should either showcase the brand’s products in an interesting way or paint a picture of what the website visitor wants to achieve after using the product.
Let’s look at an example from Fresh Heritage, a Shopify store that sells grooming products and supplements.

The image used here features a man with a well-groomed beard — something Fresh Heritage's customers would want to achieve for themselves.
Here’s another example of creative use of imagery:
Here, Mavi uses a pop-up bar with a visual that stands out and provides depth.
The bottom line is that relevant images make your pop-ups stand out more and entice potential buyers to sign up for your offer.
4) Time your pop-up so that it isn’t intrusive
The same Drip study referenced above finds that pop-ups that display after eight seconds convert better than those that display before or after. However, remember that the timing of the pop-up itself won’t necessarily boost conversions for your ecommerce store — that largely depends on how well you can check off the boxes on this list.
There are also pop-ups that appear based on scroll triggers. The Drip study reveals that using 35% of a page as a scroll trigger works best for increasing conversion rates.
You can use the suggestions that the Drip study provides as your baseline, but conversion rates depend heavily on the nuances of your brand and the customers you serve. It’s best to do A/B testing so that you can optimize your pop-ups based on what works for your business.
5) Make sure your pop-up works well on mobile
Pop-ups convert better on mobile devices than they do on desktop devices. In a study conducted by OptiMonk, the average conversion rate for desktop pop-ups was 9.69% while the average conversion rate for mobile pop-ups was 11.07%. But there’s a catch: Mobile pop-ups only convert well when they’re optimized for use on those devices.
Here are some tips to optimize your pop-ups for mobile devices:
- Ensure the pop-up doesn’t cover more than 30% of the page.
- Use only one or two pop-up form fields.
- Use the best types of pop-ups for mobile devices. Three of the best options are the floating pop-up, slidebox pop-up, and featured pop-up.
- Make it easy for the website visitor to close the pop-up.
- Ensure the CTA button and exit button are easy to click.
- Limit image sizes to less than 100KB (or don’t use images at all).
Here’s an example of a mobile-friendly pop-up from Romwe that incorporates these principles:
6) Create different pop-ups for different actions and events
Don’t limit yourself to one type of pop-up. It’s best to strategically use pop-ups throughout your website so that you can better capture your website visitors’ data. A typical shopping experience includes multiple opportunities to display pop-ups. Here are a few examples:
- Display a simple email bar on the homepage.
- Create a specific exit-intent pop-up for visitors exiting a product page that offers a discount.
- Create a pop-up that appears only on out-of-stock items to encourage your visitors to subscribe to your restock alerts.
- Create a cart abandonment pop-up on the cart page.
Here’s an example of this strategy in action on the Christy Dawn website. Notice that the website displays an email bar on the first page a visitor views.
original And if this visitor doesn’t subscribe, the store displays this complementary pop-up (you’ll notice the different wording) on out-of-stock product pages.
Note: Be sure not to display pop-ups on every page of your website. This creates an intrusive experience for website visitors — and that‘s something that search engines will penalize you for.
Related: Learn how to climb search results with our Shopify SEO guide
The 7 best Shopify pop-up apps
The pop-up checklist described above is only as good as the app used to create the pop-ups. Here are our picks for some of the best pop-up builder apps on the market to add to your ecommerce tech stack — all available in the Shopify app store.
1) SmartPopup: Promotion Popup
SmartPopup is a user-friendly pop-up builder designed to help ecommerce store owners connect with website visitors, contribute to lead generation, and increase sales. The tool has a great collection of prebuilt pop-up templates that make the setup process easy: newsletters, videos, coupon codes, product-specific, countdown timers, and automatic discounts.
Pros
- Offers a truly free plan with basic features
- Fast setup
- Customizable for those familiar with code
Cons
- Some reports of problems with the tool’s mobile version
- Free plan features are limited
- Reported issues with late or unhelpful responses from support
2) Pixelpop Popups & Banners
Pixelpop is a tool built by Orbit. Like other email pop-up tools, Pixelpop helps brands collect email addresses from leads so they can be nurtured through your brand’s email marketing campaigns.
Pros
- Pixel Union offers premium customer support
- Easy-to-use promotional bar
- Intuitive and customizable
Cons
- Some reports of slow responses from customer support
- Overly complicated for some users; support needed to use custom themes
- Klaviyo integration doesn’t work for some users
Related: Our list of 150+ of the best tools for ecommerce.
3) Quick Announcement Bar
Quick Announcement Bar is a message bar app that Shopify store owners can use to quickly post announcements on their websites — no coding required. Broadcast a free shipping bar, or a bar that displays important information and special offers.
Pros
- Bars can be set to display only on certain pages, or only to users from specific countries
- Multiple bar rotation allows multiple bars to display every few seconds
- Animated CTA button to grab visitor’s attention
- Multiple language translations available
Cons
- Only one pop-up option (the announcement bar)
- Placement limitations
4) Pop! Sales & Live Activity Pop
Pop! Sales & Live Activity Pop creates automatic sales notification pop-up windows that make your store look busy without obstructing the customer experience. It’s great for building trust with prospects who are on the fence about purchasing a product — seeing that someone else recently purchased something triggers a fear of missing out (FOMO).
Pros
- Shows real-time purchases to help boost conversion rates and social proof
- Customizable designs and advanced CSS in paid plans for easy, consistent branding
- Quick, smooth setup process
Cons
- Not great for new sellers with low traffic (you will be charged if you go over 100 web visitors a month, whether it’s real people or bots)
- Multiple reports of unauthorized charges
- Slow responses from customer support
5) Promolayer
Promolayer doesn’t only offer basic pop-up templates — there’s a full suite of exciting options that will help your website stand out such as banners, spin-to-wins, full screen welcome mats, exit offers, and slide-ins.
Pros
- Easy to customize
- Ability to run A/B tests without affecting Google Optimize data
- Built-in spellchecker to ensure your pop-ups are well represented
Cons
- Reports of some minor glitches, but the main pop-ups work well
6) Email Pop Ups & Exit Popups
Email Pop Ups & Exit Popups by OptiMonk is a pop-up app that focuses on helping Shopify store owners grow and meet their goals. With this app, you can build intuitive and attractive pop-ups for web and mobile that help you convert more visitors and collect quality feedback along the way.
Pros
- Quick and professional customer service
- Over 30 intelligent targeting and triggering options
- A/B testing
- Free version available
Cons
- Hard to customize without a developer, support, or coding experience
- No customization options on spin-the-wheel function
- Somewhat confusing setup process
Pricing
- Free: Free
- Essential: $29/month
- Growth: $79/month
- Premium: $199/month
7) Privy
Privy is an ecommerce marketing platform that helps ecommerce store owners manage their marketing with ease. One of the best features of this platform is that it incorporates both SMS and email marketing.
Pros
- Simple to setup and track SMS marketing
- Easily build automation triggers based on website visitor behavior
- Great for sending messages to customers for abandoned cart recovery
Cons
- Complaints of limited reporting capabilities
- Have to export data to assess how email campaigns are performing
- More complicated than some alternatives; users report a bit of a learning curve
- Not many options for post-purchase emailing
📚 Read more: Our list of the best apps for Shopify merchants.
Chat campaigns: A less intrusive conversion tool
If a pop-up is a perfume counter employee suddenly spraying you with the latest scent, a chat campaign is a clerk tactfully approaching to see if you need any assistance.
Gorgias’ pop-up chat campaigns are a softer way to interact with customers that don’t feel intrusive the way a full-screen pop-up does. With Gorgias’ chat campaigns , you can reach out to customers to proactively ask for support: “What can I help you with?”
Chat campaigns are a non-intrusive pop-up that appear at the bottom corner of the screen and offer help, rather than a hard sell. Gorgias customers report they can lift revenue by 13% and conversion rates by 25 to 30%.
You can set up chat campaigns that reach out to customers at key moments. For example, if a customer lingers on a product page, you can send them a discount code. If they linger with items in their cart, your chat could remind them that you have free shipping.
How ecommerce chat campaigns work
Chat campaigns can be set to active when a customer visits a particular product page, or when a certain amount of time has lapsed, or both.
When activated, the chat pops up with a message of your choosing, whether that’s an announcement, a discount, or an offer of support. When a customer replies, that’s sent directly to your customer support team in Gorgias’ helpdesk.
Chat campaigns are easy to set up in Gorgias by navigating to Settings, then Integrations, and clicking Chat. Adding a new campaign allows you to customize when the chat is fired and what message customers will see.
If a customer does respond and creates a ticket, Gorgias helps you set up Rules to determine priority level for your customer service agents.
In addition, the chat button can be programmed so when a customer clicks, they get automated self-serve options such as tracking their order, canceling an order, or filing a ticket.
Examples of chat campaigns
There are several ways to implement chat campaigns so we’ll go over some examples of chat pop-ups in action.
Spark conversion around specific products
The chat campaign can be used to give specific products a boost or offer help. For example, if your core product is shoes, the chat campaign could pop up with advice on sizing.
Think of it as another space for frequently asked questions. Using the pop-up, you can satisfy those questions without the customer having to go looking for answers themselves, or file a ticket.
Here’s an example from Franklin, a French pet food brand. They programmed chat campaigns to appear on product pages for specialized foods, so shoppers can ask questions and make sure they’re buying the right product.

Share limited-time offers and product-specific discounts
Traditional pop-ups are one way to announce an offer or sale, but a chat campaign can do this as well, in a more friendly way.
A chat campaign message with a special offer feels more exclusive than a flashy pop-up and can be customized for individual products, for example offering a percentage off your best-selling item.
Capture high-value customers
Let’s go back to Jaxxon for an example of how to get the attention of customers browsing your best-selling products.
When a customer clicks to view Jaxxon’s Cuban Link Chain, their top gold chain under $100, the chat campaign pops up to help. The campaign offers a list of styles under $100 and a style quiz.
Neither of these are hard sells but ways to engage the customer and help them find just the right product. From here, customers can click the links to type to reply and speak to customer support.

Why chat campaigns are better
Pop-ups are risky business. Although they can lead to conversions, pop-ups that are intrusive can turn customers away. A chat campaign is a solution that combines all the useful parts of pop-ups with excellent customer service and a gentler approach.
Chat campaigns:
- Are small, unobtrusive, and take up less screen space
- Less invasive with a time delay
- Employ a less aggressive sales approach
- Are fully customizable to target particular products
- Provide a direct path to human interaction
- Have a wide variety of use cases
- Are SEO-friendly
Boost your conversions with Gorgias chat campaigns
There’s a lot of ways to improve your ecommerce store’s conversion rate and chat campaigns are a proven method to do just that.
Chat campaigns are fully integrated into the Gorgias helpdesk, with your live chat and campaign options all available in one place. Plus, with the ability to bring in a customer’s unique information and order history, you can provide a truly custom customer experience.
Learn more about how Gorgias can help you provide amazing customer experiences.

10 Customer Apology Email Templates to Help Retain Business
You can — and should — prepare for these mishaps with a library of apology email templates. A timely apology email builds trust, prevents churn, improves your retention rate, protects your bottom line, and keeps your company name in good standing.
According to KPMG, 46% of customers who are truly loyal to a brand will remain so even after a negative experience. They’re also far more likely to recommend a brand to friends and family or write a positive review online.
An effective apology email is your best bet to regain and reinforce customer loyalty after an error or delay. And loyal customers are closely linked to revenue. According to data from more than 10,000 Gorgias merchants, repeat customers generate 300% more revenue than first-time customers.

Continue reading to learn the key components that every effective and sincere apology email should have, as well as some dos and don’ts, to keep customers on your side.
{{lead-magnet-1}}
How to write customer service apology emails (the dos and don’ts)
Apologies can repair the situation or make it worse. If you bungle the apology, you risk losing a customer forever. But a well-executed apology can strengthen your relationship with a customer, as Brianna Christiano, Gorgias's Director of Support, explains.
“In my experience, proactively sending an apology email and admitting that maybe you made a mistake as a company, or you didn't provide the best experience, really builds trust with customers,” says Christiano. “You'd be surprised how many customers will forgive you for that mistake.”
This list will prepare you for creating your own customer service apology emails to make sure you correct the situation without making it worse.

Do: Create a library of brand-appropriate apology email templates
When a mistake happens, you don’t want to be left scrambling. Being prepared ahead of time with email templates will allow you to send out on-brand apology emails and correct the mistake as quickly as possible.
It’s also critical that everyone on your customer support team has access to those templates. Make this part of your customer service training and onboarding to ensure that every customer is receiving the same level of care when an apology needs to happen.
With Macros, Gorgias customers can build a library of customer service responses, including apologies, to send as emails to customers. You can respond directly to tickets in your helpdesk using these Macros and ensure consistent messaging (and the right customer service words), no matter who responds.
Macros are templates that you build for common ticket responses, such as shipping inquiries or apologies, that can be further customized with individual customer information.
Macros integrate with ecommerce platforms (like Shopify or BigCommerce) so you can insert personalized information for each customer. Here’s an example of how Macros use variables to pull customer data directly from BigCommerce (in this case) and automatically personalize the message:

Don’t: Wait to apologize
Speed is of the essence when it’s time to send a customer apology email. You should send an apology as soon as you see something has gone wrong, rather than waiting for a customer complaint to come in.
Frustrating or negative customer experiences decrease loyalty. According to The Effortless Experience, 96% of high-effort experiences — such as having to contact the company — make the customer feel disloyal afterward. Frustrated customers can easily turn into angry customers.
“Instead, you're reducing the escalation upfront by being proactive,” says Christiano. “When the company sends an email about an issue the customer didn’t notice, customers appreciate that the company has gone above and beyond.”
Gorgias analyzes incoming tickets for sentiment to detect angry and escalated customers so you can address them before they take their anger out on social media and cause further damage.

You can then apply rules (or automation) to filter tickets based on sentiment and prioritize your customer responses.
Do: Personalize the apology to each customer based on past interactions
A personal apology is always a more sincere apology. When you create your templates for customer apology emails, leave spots to insert personalized information about the affected customer, from the customer’s name to more detailed order information.
You can get even more detailed than that, though. Using Gorgias’ Customer Sidebar feature, your customer success or support team can see information in the sidebar such as:
- Past orders
- Reviews
- Loyalty status and points
- Previous conversations
For example, you could thank a customer for a past review (“Thanks so much for your kind words about our matcha powder!”), or reference a past order (“How did you like the matcha powder you ordered last month?”).
Or, go above and beyond ("Again, so sorry for this issue. I noticed you're a frequent shopper here and I want to thank you for your business and patience as we sort this out — here's a discount code for 15% off your next order: SORRY15!").

If you see a customer has left a negative comment in the past, mention it and tell them how that feedback has helped your brand to correct the issue and provide better service.
Taking the time to personalize customer interactions, including apology emails, directly impacts your revenue. According to a study by Twilio, 98% of companies say personalization increases customer loyalty. Additionally, customers around the world spend an average of 46% more when engagement is personalized.
Don’t: Send your email to unaffected customers
Being proactive with your apology letters is important, but you can also go too far. Sending these emails to customers who haven’t actually been affected by the issue will just create more headaches for your customer support reps.
“Before you send a mass email to 50,000 customers, make sure that most of those people were impacted. Because if you don't, you're going to create more confusion,” says Christiano.
If, for example, you’re having supply issues, don’t send a mass email to every single customer. Those whose orders are actually unaffected will now think there’s a problem with their orders even if there’s not. That’s going to mean more incoming and unnecessary tickets for you to deal with.
Do: Maintain a tone that reflects your brand but also the severity of the mistake
Every company has a different brand identity and style of communication. For some, it may be on-brand to send communications with emojis and playful wording. Others may prefer something more simple and elegant. In any case, you may need to adjust that voice for customer apology letters.
This starts right from the subject line. If a customer’s order is delayed, whether due to shipping issues or stock shortages, that’s a serious issue. Sending a subject line with cutesy wording like “oops” and frowning emojis may communicate that you’re not taking the delay seriously.
“If it's a small inconvenience, I think you can keep it lighter. It really just depends on the severity of the problem,” says Christiano.
Here’s an example of a small mistake that justifies a light-hearted tone:

And here’s an example of a graver issue, handled with more detail and a serious tone:

In the body of the email, use straightforward language that clearly acknowledges the problem rather than dancing around the issue and directly communicate how you’ve corrected the mistake.
Again, this is where creating personalized email apologies comes in. Christiano says you should look at factors like:
- The price point of an order
- The customer’s order history
- The customer’s VIP or loyalty status
- The tone of past reviews and conversations
Adjust the templates below to fit with your brand’s unique voice, but don’t forget that the wrong tone can make an apology email less effective.
Don’t: Leave the customer empty handed
A sincere apology to your customers should directly acknowledge the issue, take full responsibility, tell them what steps are being done to correct it, and give them a reason to come back and shop again.
Consider ending apology letters with some sort of offer — a voucher code for free shipping, a discount coupon code, store credit, or other perks. This demonstrates that you understand the customer has dealt with an inconvenience and you want to make it up to them beyond sending your “sincerest apologies.”
Christiano says it’s a good rule of thumb that if an issue is serious enough that you need to send an apology email, it’s worth considering including some sort of offer. For the most serious issues, you may even want to offer a full refund to retain that customer.
Here’s a great example of a mass email apology that extends the discount for goodwill (and more sales):

Don’t think of offering a coupon code as a further loss. It’s better to take a small hit on the next purchase than to not get the next order at all. Plus, an angry customer may leave negative reviews on your site or social media, driving away other potential customers and impacting your customer satisfaction (CSAT) score.
10 apology email templates for every type of mishap
Below you’ll find useful email templates for every type of apology you may have to send as a brand. These apology email examples have spaces for you to insert personalized information for each customer, such as the customer’s name and shopping history. Use these as a starting point to craft your own letter templates.
1) Service or website outage or downtime (mass email)
This template is for when you’ve had site-wide technical issues or glitch that has impacted your entire customer base. Mass emails are less customized than individual emails, but should still contain all the key parts of a good apology.
Hi {{Customer first name}},
We’re currently experiencing a service outage for {{Website / Product / Service}}. We’re actively working on resolving the issue, which we believe is due to {{Reason for outage}}. We apologize for the inconvenience and assure you we’ll have everything up and running as quickly as possible.
Stay tuned at {{Website / Social media page}} for the latest updates.
Thanks,
{{Current agent first name}}
2) Late shipment or delivery (individual)
This is for when a customer’s order will be sent out late. This is when you should consider how to tailor your apology letter to the unique customer and their history with your brand.
Hi {{Customer First Name}},
We regret to inform you that your order {{order number}} has been delayed.
We apologize for any inconvenience, and we appreciate your understanding. The reason for the delay is {{reason for the delay}}.
You can track the status of your order using this tracking link {{Link to tracking portal}}.
If you’d like to return or exchange your order, you can do so here {{Link to return/exchange portal}}.
Once again, we apologize for the inconvenience. Please let us know if you have any questions or can provide further assistance.
Best,
{{Current agent first name}}
3) Late shipment or delivery (mass email)
This is for when you have a company-wide issue with delivery times, such as stock shortages or even shipping issues beyond your control, and need to send a mass apology email.
Hi {{Customer First Name}},
We’re reaching out to let you know that we’re currently experiencing shipment delays, largely due to {{Cause (e.g. supply chain issues, holiday rush, broken workflows, etc.}}. There will most likely be delays of {{range of business days}} on recent orders.
We understand this is a serious issue and are doing everything in our power to fulfill your orders as quickly as possible. For more information on shipping delays, you can check out {{link to FAQ page}}. If you have any other questions, please feel free to reach out to our team by responding to this email.
Best,
{{Current agent first name}}
4) Package never arrived
This is a customer whose order has been lost This will likely be sent in response to an incoming ticket from an upset customer.
Hi {{Customer First Name}},
Thank you for reaching out! I’m so sorry to hear that you were unable to locate the missing package. Rest assured we will remedy this situation for you.
I have two options to offer: we can ship a replacement to you or issue a full refund for the order instead. If you prefer a replacement order, we kindly ask that you confirm the shipping address of where you would like the replacement order sent. We look forward to receiving your reply.
{{Current agent first name}}
5) Item arrived damaged
This is for when a customer receives a defective product. You’ll need to provide instructions on what the customer should do next, in addition to an apology.
Hi {{Customer First Name}},
Thanks for reaching out about your recent order {{Number of last order}}. I’m sorry to hear about your experience. As we try our best to provide exceptional service, some factors like shipping and handling are out of our control and issues like this can happen.
Please send us a photo of the broken/damaged item(s) you received and we’ll do our best to resolve this as soon as possible.
{{Current agent first name}}
6) Incorrect item delivered
If the incorrect item, or incorrect quantity of an item, is delivered you’ll need to apologize but also tell the customer what they should do with any incorrect items.
Hi {{Customer First Name}},
Thank you for letting us know we sent you the wrong product. We apologize for the inconvenience. We are sending you the correct product, the {{correct product name}} and it will be shipped by {{estimated shipping date}}.
We sent it using expedited shipping, so you should receive it {{estimated delivery date}}. Please return {{old product}} in the original shipping box and packaging using the attached shipping label and instructions. Please contact us with any additional questions.
{{Current agent first name}}
7) Previous communication mistake
If you sent a piece of email marketing with an incorrect or missing discount code, for example, you should follow up with an apology and correction. And, if it’s not too complicated, explain what caused the miscommunication in the first place, and the steps you’ve taken to prevent it from happening again.
Hi {{Customer First Name}},
On {{day of the communication mistake}}, we experienced a hiccup with {{cause of the error}}. This resulted in you receiving a confusing email — sorry about that!
We addressed the issue and hope to avoid this happening in the future. As a way to apologize for any confusion caused by the last email, we {{Insert policy: temporary discount, free shipping, personalized code, added a credit, etc..}}.
Thank you for understanding. Please respond to this email with any questions!
Best,
{{Current agent first name}}
8) Reply to a bad customer review
When a customer is upset, a professional apology can go a long way to correcting the issue and retaining their business.
{{Customer First Name}},
Thanks so much for your feedback on {{Customer survey, review site, etc.}}.
I wanted to check in and get a little more information from you about your experience. This will help our team improve future experiences for you and other shoppers. If you’re open to it, you can just reply to this email and share your thoughts.
Thanks for your time,
{{Current agent first name}}
9) Poor service experience
As we’ve discussed, poor customer experience can decrease loyalty. Correcting the issue and apologizing can help get that loyalty back.
Hi {{Customer first name}},
Thank you for reaching out and letting us know about your experience with us. This is not up to our standard and I've passed this along to our team to ensure this doesn't happen again.
In addition, I've {{Insert policy: refund, added a credit, send a replacement, etc.}} to make this right.
We truly value you as a customer and apologize for the inconvenience this caused.
Please let me know if I can help with anything else.
{{Current agent first name}}
10) Escalated customer
If a customer is already escalated, you need to have an apology email that reflects how the customer feels. Unhappy customers can cause lots of damage beyond lost business, including damage to your reputation through social posting and reviews.
Hi {{Customer first name}},
Thank you for reaching out and letting us know about your experience with us. This is not up to our standard and I've passed this along to our team to ensure this doesn't happen again.
I have CC’d {{Technical/Lead agent first name}} on this email. They will be able to figure out what happened here and ensure that we resolve this for you.
{{Current agent first name}}
Winning back upset customers is worth it
When mistakes happen, remember that your most valuable customers are the ones who come back again and again. Mistakes create a risk of losing a customer, but it’s also an opportunity to rebuild loyalty and turn a bad situation into a chance for a positive customer service interaction.
Your customer service team should have a clear process in place for winning back upset customers and having a thorough library of sincere, on-brand customer apology emails is a key piece of the process.
For further reading on customer responses, read about Gorgias’ other customer email templates and customer service scripts inspired by top ecommerce brands.
Start a demo with Gorgias today to streamline your customer responses and get the best possible return on investment with customer service.Mistakes happen. Even with the best-laid plans, your ecommerce business will inevitably run into shipping delays, website outages, and other mishaps that cause customer complaints.
{{lead-magnet-2}}

14 Ecommerce Shopping Cart Best Practices To Increase Conversions
The trick to ecommerce is having great products and attracting a bunch of people to your website. Right? Not quite.
Great products and brand awareness are important, but so are all the little details that make up your website’s shopping experience. Everything — from the way your products are categorized to the live chat widget (or lack thereof) — impacts how successfully you can turn browsers into buyers, also known as your site’s conversion rate. One of the most important of those elements is your online store’s shopping cart.
In this article, we’ll explore everything that happens after a website visitor clicks “Add to cart,” including the reasons customers abandon carts and 14 shopping cart best practices to encourage customers to keep shopping and place an order.
{{lead-magnet-1}}
How damaging is cart abandonment for your brand’s revenue?
Shopping cart abandonment is when a customer adds items to their shopping cart on your website, but leaves before making the purchase. Recent data from the Baymard Institute shows that the average shopping cart abandonment rate is 69.82%. This means that about seven out of every 10 shoppers at your store will not click “purchase.”
Baymard also crunched the numbers to find out that companies across the U.S. and Europe collectively lost out on $260 billion worth of revenue due to cart abandonment. This revenue could be recovered through a stronger checkout flow and cart design.
What causes shoppers to abandon shopping carts?
The next layer of navigating how to address checkout abandonment issues revolves around reasons for abandonment, which run the gamut. Baymard’s research reveals the top reasons for cart abandonment:
Let’s dive into some of the top reasons.
Multi-step checkout processes
A checkout process that requires the customer to go through multiple steps is one reason that customers abandoned their carts, as cited by the Baymard survey from late 2021. Of those surveyed, 17% say that they didn’t complete their purchase because the process was “too long or complicated.”
It’s vital to get your shoppers to quickly find a checkout button that actually completes the purchase, in as few clicks and screens as possible.
Gated checkout processes
If you require customers to create an account before checking out, you’re most likely losing some of them before checkout. Simply put, people don’t want to be forced into creating an account (that will most likely lead to emails they do not care for in their inbox) just to purchase a product from your company. In the Baymard study, 24% of consumers report “the site wanted me to create an account” as their top reason for abandoning during checkout.
Even if customers do comply and create an account, they may be annoyed or frustrated by having to do so — which your company should avoid at all costs in order to ensure an excellent customer experience.
Not enough payment options (or missing convenient options)
Another reason for cart abandonment cited in the Baymard survey was “not enough payment methods.” This could mean that an ecommerce company doesn’t accept certain credit cards or other payment options like PayPal.
When your online store accepts multiple payment methods, you are more likely to meet each customer’s individual expectations. This leads to a sense of convenience and a smoother customer experience.

Lack of trust in the shopping cart’s security
Most online shoppers want to feel a sense of trust before plugging their credit card details into any website. Baymard’s 2021 survey finds that 18% of customers say they abandoned their online cart because they did not feel that the ecommerce store was trustworthy.
It’s important to make your customers feel secure, specifically when dealing with privacy and sensitive data like credit card numbers and personal information. Social proof like customer reviews on your products, as well as security guidelines like secure sockets layer (SSL) and payment card industry data security standard (PCI DSS), are a great way to bolster trust among first-time visitors.
Surprise shipping charges or long delivery wait times
Finally, the most commonly cited reason for cart abandonment among consumers is surprise shipping costs or long delivery wait times. According to Baymard, “extra costs” and “delivery was too slow” made up 68% of survey responses. This shows just how much shipping can impact whether or not someone chooses to go through with ordering your product.
Related: Trying to improve your shipping experience? Check out our guides on shipping for ecommerce and how to offer free shipping.
14 optimization tips for the best shopping cart experience
- Offer the right payment options
- Don’t require shoppers to create an account in order to buy
- Add “mini cart” functionality to keep your cart visible
- Make product descriptions and thumbnails visible on the shopping cart page
- Limit the customer information you collect
- Provide total cost estimates during checkout
- Use breadcrumbs to show the number of steps in your checkout process
- Create an abandoned cart workflow automation
- Give your customers multiple shipping options
- Implement an auto-save feature for items in shoppers’ carts
- Offer a live chat feature on the checkout page
- Make it easy for customers to move between their cart and product pages
- Use your shopping cart for upselling and cross-selling
- Add a “Buy now” button to skip the shopping cart
Now that you know some of the top reasons customers are abandoning their carts, let’s look at some best practices you can implement to give customers a positive shopping cart experience — and lower your cart abandonment rate.
1) Offer the right payment options for your customers
As mentioned, a lack of payment options is one reason customers abandon their online shopping carts, so ensuring your ecommerce website has options is vital. According to SaleCycle, the majority of online shoppers want the option to pay for purchases online with either a digital wallet (digital payments not attached to a card), credit card, debit card, or bank transfer.
The more options you have available, the better. Additionally, some payment options can also make checkout faster and easier for customers, which also helps with cart abandonment rates.
Pro tip
Be sure to think about which payment types will make the most sense for your customers and your business size. If you are just starting out and have a limited budget, consider starting with PayPal or Venmo. Once you start growing, expand to include all the major payment options: Visa, MasterCard, American Express, Discover, Apple Pay, PayPal, and maybe even a buy-now-pay-later option like Klarna or Afterpay.
Also, consider investigating whether your ecommerce platform has express checkout options. Shopify, for example, has express checkout options that let people pay through services like Amazon so they can skip typing out contact, payment, and billing information. Here’s an example of express pay on CROSSNET’s website:

Read more about choosing payment options for your ecommerce business.
2) Don’t require shoppers to create an account in order to buy
Shoppers don't want to create an account in order to make a purchase, so eliminating this requirement (if you’re using it within your online store) can be a quick fix for boosting conversions.
The National Retail Federation reports that 97% of cart abandonment is due to inconvenience. So, keep the shopping cart design as simple as possible — give customers the option to create or sign into an account, but also provide a guest checkout option with a prominent checkout button.
Pro tip
Give customers the option to create an account via social media or their Google account after they purchase. This taps into the convenience factor, and gives you a chance for future email marketing or customer loyalty programs.
Also, if you have subscribe-and-save functionality, make the discount clear to customers throughout the checkout process — again, without making it mandatory. Olipop’s “Add to cart” option is a great example of advertising the better deal without sacrificing usability for the shopper:

3) Add “mini cart” functionality to your ecommerce site to keep your cart visible while browsing
Keeping a customer’s online shopping cart accessible while browsing is another best practice that can help decrease cart abandonment. A mini cart makes the shopping process much more seamless because customers can easily add products to their cart — or review current cart contents — in a drop-down and without being directed to a new page. This can help minimize potential website loading issues, which Baymard’s survey cites as a top reason that customers abandon their carts during checkout.
Pro tip
Mini carts are usually a simple add-on, depending on which platform your online store is based. Both Shopify and WooCommerce offer mini cart options that you can easily add to your shop. If you’re looking for a brand that has a successful mini cart, check out fashion retailer Marine Layer. Here’s the drop-down that happens if you hover over the cart icon:

Looking for more Shopify-specific tips on abandoned cart recovery? Read more here.
4) Make product descriptions and thumbnails visible on the shopping cart page (where it makes sense)
Adding your product details to customers’ carts can be extremely helpful — if it makes sense for your business.
For example, if you sell power tools and a customer is purchasing new drill bits, they may want to double-check that the drill bits they put in their cart are the correct size. So, in order to keep them on the checkout page, include a brief description below the product name. This eliminates the need to go back to the main product page, which eliminates the potential for slow page loading and frustrated customers.
Pro tip
The product description on the checkout screen doesn’t need to be long or complicated — one or two solid sentences from the original product page will do. Or, if your company sells highly visual merchandise, a thumbnail — a picture’s worth a thousand words, after all. One store that add thumbnails to their shopping carts is Glamnetic:

5) Limit the customer information you collect to only the essentials
Everyone values their personal privacy, especially when shopping online. ROI Revolution reports that ”39% of consumers say they have maintained the same level of concern about their online privacy over the past year and 20.5% of consumers say they’re much more concerned about their online privacy compared to one year ago.” Only 8.6% of online shoppers say they’re less concerned now than they were a year ago.
This is why it’s so important to only collect information from your customers that is absolutely necessary. In a typical shopping transaction, these essentials would include things like email address, phone number, and street address. In some cases, you might also ask for some basic demographic info that’s important to your company’s segmentation, such as gender and purchase habits. You may offer the option to keep customers’ credit cards on file, but we don’t recommend doing this without their permission.
If customers do opt to keep their credit card information stored on your site, be sure to let them know exactly how this works. Most companies take advantage of encrypted online or cloud-based storage systems. Let customers know there are even regulations that dictate what you can and can’t do with your information. This will help put them at ease and show that your brand is trustworthy.

Pro tip
Offer customers two-factor authentication (2FA) or multi-factor authentication (MFA) when shopping on your site, which signals to your customers that you take their privacy seriously. Many companies have opted for MFA or 2FA in the past few years, and you can use Amazon Pay or Google Pay as a version of 2FA on your ecommerce site.
6) Provide total cost estimates during checkout to reduce sticker shock
As pointed out earlier in this article, unexpected fees are cited as the most popular reason that customers abandon their carts before checkout. To avoid this, give customers an estimated subtotal before they get to the checkout screen. This can be especially important for larger-ticket items because shipping a $1,000 sofa will most likely come with a higher shipping fee (and more tax) than a box of clothing.
Pro tip
When a customer is on a product page, include an option to enter their zip code to calculate a preview of tax and shipping before they click “add to cart.” Native Union does an excellent job of this on its website. They even break down the costs for various shipping options like standard and express delivery:
7) Use breadcrumbs (progress indicators) to show the number of steps in your checkout process
The breadcrumb feature can be used in many ways on websites but has a specific use for ecommerce checkout processes. Letting customers know how much time, or how many steps, they have left in the checkout process is important to ensure they complete their purchase. Progress indicators can be as simple as a little block of text on the checkout screen that says “1 of 3,” or can use graphics for more visual appeal.
Pro tip
Take this time to think about each step of your business’ checkout process and make it as simple as possible. The more steps a customer has to go through, the more chances you have to lose them. Shopify’s default checkout page has a clear progression from Cart > Information > Shipping > Payment, which you can see on Comfort One Shoes’ site:

8) Create an abandoned cart workflow automation for customers that leave items for later
Some ecommerce sites let customers add items to a wish list or “save for later” to reduce the number of times customers add items to a cart without plans to buy them in that shopping session. Regardless of whether you have that functionality, you should create a workflow for customers who leave items behind.
This workflow could include things like email reminders, on-screen pop-ups, retargeting ads, and sending follow-up coupon codes. It’s important to keep in mind the specific goals of your ecommerce business. What may be right for some brands may not be right for yours.
Pro tip
Timeliness is everything when it comes to your abandoned cart workflow. When customers are ready to buy, you must be there. Some sites use exit-intent pop-ups as a hail mary for customers about to abandon carts. And while this is effective, some customers find it disruptive.
Consider instead adding live chat to your website, ideally with proactive functionality. Live chat can have an incredible impact on sales — Ohh Deer generates about $12,500 per quarter in sales through Gorgias’ live chat — because you can reach out to customers with certain order values in their cart to ask if they need support or offer a discount to stop them from leaving.
"When you make sales thanks to your good service, customers will come back and recommend you. That's revenue-generating."
Alex Turner, Customer Experience Manager at Ohh Deer
Check out our guide to shopping cart recovery for more recommendations on winning back lost sales.
9) Give your customers multiple shipping options
Every customer has different expectations and needs when it comes to shipping. Offering robust shipping options expands the number of situations your ecommerce business can seamlessly respond to. Beyond helping to decrease your brand’s cart abandonment rate, providing various shipping options can lead to more sales as well as higher retention and customer satisfaction.
Pro tip
Take into account your target customers’ needs and try to cater to every shipping scenario, which could include the following options:
- Flat-rate shipping (4-5 business days)
- Expedited shipping (3 business days)
- Next-day/overnight shipping (1-2 business days)
- Local pick up, especially if you have a large number of customers in the city where you operate
Regardless of your options, clarify the price as early as possible to avoid unwanted surprises. Here’s the clear layout of shipping costs on Sol de Janeiro’s website:

10) Implement an auto-save feature for items in shoppers’ carts
At this point, you know many of the reasons customers may abandon their shopping carts online. From frustration and slow page loading speed to simply being distracted, customers leave their carts a lot, so implementing an auto-save feature on your website can help decrease your shop's cart abandon rate. A customer may be distracted and leave your website, but then come back to it a few days later. When they reopen it, their saved cart will remind them of their previous intent to purchase.
Pro tip
Tap into your website management software to see if an auto-save feature is available. It may be as easy as flipping a toggle. If you use Shopify, you can also save carts between visits so customers can retrieve their old carts when coming back to your site.
11) Offer a live chat feature on the checkout page for customer questions
Most customers (90%) expect an immediate response to their customer service inquiries, according to HubSpot. Being able to provide your customers with this support through a live chat feature can boost the overall customer experience, as well as improve your store’s cart abandonment rate. Even more, Kayako reports that 79% of businesses say offering a live chat feature positively impacted sales (including upsells), revenue, and customer loyalty.
Pro tip
Use Gorgias for live chat (and more). The live chat widget can seamlessly integrate with your Shopify store and provide a solution for customers who may have questions at the time of purchase to drive sales. You can even use chat campaigns to target certain customers — like those lingering on a checkout page — to see if they need information or a discount to complete the purchase:

Want to learn more about the power of live chat for ecommerce? Check out these lists:
- The best live chat apps (general)
- The best live chat apps for ecommerce
- The best live chat apps for Shopify
- 22 statistics about live chat
Alternatively, if you already have a live chat app in mind, learn how to install it into your Shopify store.
12) Make it easy for customers to move between their cart, product pages, and more in your online store
Ensuring the design and user experience of your ecommerce shop is up to par is the last but extremely important best practice when it comes to lowering your cart abandonment rate. You’ll want to ensure customers can move through all areas of your website with ease.
Pro tip
Explore new features and add-ons that your website software offers. If you’re currently building everything yourself, we encourage you to check out how a tool like Shopify can drastically elevate your customers’ experience while not taking too much time away from your team. For inspiration from an online retailer who does this well, check out skincare brand Then I Met You.
Related: Learn how to offer proactive customer service to improve your customer experience.
13) Use your shopping cart for upselling and cross-selling — with limits
Your shopping cart can be a good place to recommend additional products to browsers. This is especially true if some of your products require others for full functionality.
As you can imagine, pushing items onto customers before they’ve even decided whether they want to make a purchase in the first place is dangerous. They could get annoyed and abandon the purchase altogether. So, if you do decide to add this to your store, do so strategically. For example, Little Poppy Co. uses in-cart recommendations to offer a discount and subscribe-and-save option, which many customers may appreciate.

Tools like In Cart Upsell and Cross Sell can activate this feature on your store.
14) Add a “Buy now” call to action (CTA) button to skip the shopping cart altogether
As we described above, the shopping cart is a bit of a minefield. Customers can fall off at any second and decide not to buy anything or, worse, check out your competitor’s website. One way to avoid issues is to let shoppers skip the shopping cart altogether and let customers just buy the product.
If you use Shopify, check out their article on Buy Buttons for more information, including some words of warning about the button’s shoddy functionality.
Check out Loop Earplug’s website for a good example of a clear, visible button to skip the checkout process and buy now:

“We’ve seen 43% increase in revenue from customer support since we launched pre-sales flows. Quick response flows give us the ability to build trust with our customers and that’s priceless. When customers get a quick and honest answer, they often end up buying more than one product in a short span of time. Seeing customers live the life we’re aiming to create for them in Loop Earplugs is extremely rewarding for us.”
- Milan Vanmarcke, Customer Service Manager at Loop Earplugs
3 amazing ecommerce shopping cart experiences to inspire you
Finally, let’s take a look at what we consider to be the gold standards of ecommerce shopping experiences. Don’t hesitate to take some ideas back for your online shop — they may be exactly what your ecommerce strategy needs.
Revolve
Clothing retailer Revolve is a top example of a clean, efficient customer checkout process. The brand doesn’t force customers to log in or sign up for an account in order to purchase — but does give the option. Revolve also provides a live chat option, as well as text and phone numbers to get a hold of a customer service rep should a question come up.

Amazon
Amazon is another leading example of a shopping cart experience that covers a lot in a small amount of space. Though it may seem busy for some customers, Amazon features additional information about the product a customer is buying right in the checkout screen, such as the stock count (if there is a low number), eligibility for free shipping, and even information about if the product is Climate Pledge Friendly.

Nike
Third, we’re highlighting the athletic wear brand Nike. The company takes a similarly minimalistic approach to Revolve, but is a top-tier example of breadcrumbing and providing estimated additional fees like shipping and tax. The brand also provides a product description on this page, which can be especially helpful when purchasing shoes.

Take your ecommerce customer service to the next level with Gorgias
Providing a smooth shopping and purchasing experience can lead to a satisfying, stress-free customer experience. Ensuring a positive customer experience will lead to greater customer experience which has a huge impact on your revenue.
To make the process even more seamless, we recommend checking out Gorgias to manage all of your customer support in one place. The all-in-one platform was built specifically for ecommerce businesses and can integrate easily with other online shop platforms like Shopify, BigCommerce, and Magento. Learn more about how Gorgias can optimize all customer interactions and streamline your business.
{{lead-magnet-2}}
FAQ Pages: Examples, Benefits, and When to Add a Help Center
TL;DR:
- FAQ pages deflect repetitive support tickets and reduce response times by providing instant self-service answers
- Strong FAQ pages combine clear categorization, search functionality, and schema markup to capture organic traffic
- Top-performing examples from Amazon, Nike, and Etsy use accordion user interfaces (UIs) and contextual placement across product pages
- Creating an effective FAQ requires mining customer data, writing concise answers, and maintaining content freshness
- Schema markup can earn rich results for government and health sites, though eligibility is limited
Shoppers expect instant answers, but support teams can't scale 24/7. FAQ pages bridge this gap by providing self-service resources that work around the clock.
A well-executed FAQ page reduces ticket volume while building trust with shoppers. This guide covers proven examples, creation steps, search engine optimization (SEO) implementation, and strategies to measure your FAQ's impact.
What is an FAQ page?
An FAQ page is a self-service resource that answers your shoppers' most frequently asked questions in one centralized location.
The questions typically cover key information relevant to most visitors: operating hours, product availability, pricing, return policy, basic troubleshooting, and more.
By providing these answers proactively, customers get the information they want immediately without contacting your support team. FAQ pages are fairly low-tech but highly strategic.
You can create an FAQ page in just a few hours and start seeing benefits immediately, whereas more advanced customer service strategies like customer service automation and omnichannel customer support require more investment.
FAQ vs. Help Center (when to use each)
A Help Center is a broader knowledge base that includes detailed articles, tutorials, video guides, and, in some cases, community forums. It serves as a comprehensive resource for complex topics that require step-by-step explanations or troubleshooting flows.
An FAQ page, by contrast, is a focused Q&A list designed for high-frequency, straightforward questions that can be answered in a few sentences.
Use an FAQ page when customers need quick answers to common questions like shipping costs, return windows, or order status. Build a full Help Center when your products or services require detailed guidance, technical documentation, or multi-step tutorials. Most ecommerce brands benefit from both: an FAQ page for speed and a Help Center for depth.
Why FAQ pages matter
We identified the FAQ page as one of our top customer service trends because more brands have realized how much time their customer support teams can save by implementing effective self-service resources. FAQ pages aren't just great for agents, they're great for customer experience.
Reduce support tickets (deflection)
FAQ pages intercept repetitive inquiries before they reach agents, a strategy called ticket deflection. A Microsoft study shows that 66% of all customers consult self-service resources before contacting an agent. Your team doesn't need to spend hours answering questions about return policies, shipping rates, or order status.
Reducing repetitive tickets improves your customer service response time and frees up agents to work on sensitive, urgent, or higher-value support tickets. self-service resolves up to 60% of common inquiries, letting your team focus on conversations that actually require human expertise and build customer relationships.
Creating an FAQ page to answer common customer questions is one of our top tips in our CX-Driven Growth Playbook. The playbook shares 18 actionable tactics to boost revenue by 44% by improving CX. Our team created it using data from over 10,000 Gorgias merchants and in-depth interviews with 25 top ecommerce brands.
Improve conversion and trust
Shoppers experience pre-purchase anxiety about shipping, returns, sizing, and product quality. They need clarity before buying, especially when visiting your site for the first time. An FAQ page addresses this anxiety by demonstrating transparency and making essential information easy to find.
Earning shopper trust is key to growing your store, and a well-organized FAQ page shows customers you have clear policies for essential buying considerations. When answers are readily available, cart abandonment drops because customers feel confident moving forward with their purchase.
Capture organic and AI Overview traffic
If properly search-optimized, your FAQ page becomes another entrance point into your website from Google. A Help Center article from FIGS, a direct-to-consumer (DTC) scrubs brand, appears on the first page of Google's search results for the question:
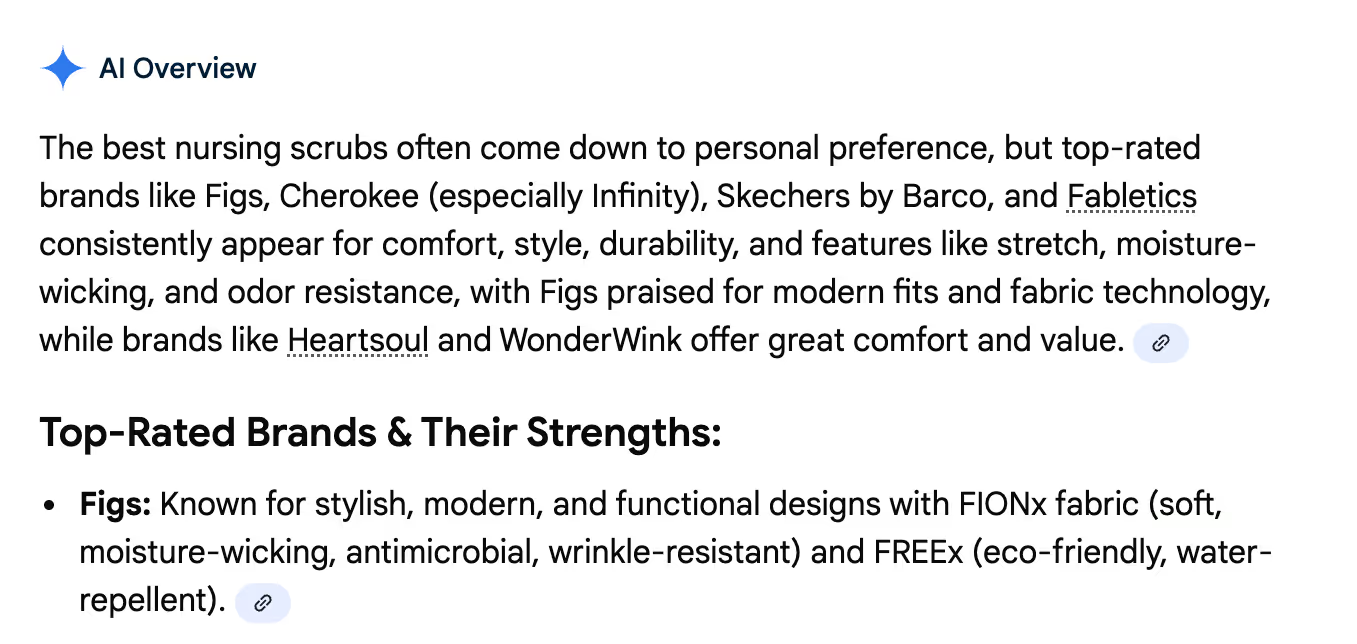
The person who searched the question might click this link, find their answer, explore FIGS' website, remember the brand, and eventually return to make a purchase. Schema markup, which we'll cover later, helps search engines understand your FAQ content and include it in these valuable search features.
Shorten time-to-answer
FAQ pages provide 24/7 availability, unlike human support that operates during specific hours. Global customers across time zones can find answers immediately, regardless of when they visit your site. For simple inquiries, 68% of people would rather use self-service resources like an FAQ page than contact an agent and wait for a response.
Mobile accessibility makes FAQ pages even more valuable for shoppers browsing on-the-go. Of course, some customers prefer human support, and many questions are too complex for an FAQ page. Offer a healthy combination of self-service and human support to cover the entire range of customers and questions.
Best FAQ page examples
Studying what works on screen helps you understand effective FAQ design patterns. These nine examples from brands of all sizes showcase different approaches to organization, search functionality, and visual presentation.
Amazon
Amazon's help center creates a tailored experience using customer data and purchase history. When you log in, the FAQ prioritizes topics relevant to your recent orders and browsing behavior. Amazon also integrates AI-powered conversational support alongside traditional FAQ sections, letting customers choose their preferred path to answers.
The platform seamlessly connects FAQ content with account history and order tracking, so customers can resolve issues without leaving the help interface. This contextual approach reduces friction and keeps resolution times low.
WhatsApp Help Center
WhatsApp's FAQ page features clean categorization with expandable sections that keep the interface uncluttered. The conversational tone matches WhatsApp's brand voice, making technical information feel approachable. Each answer is concise and written in plain language, avoiding jargon that might confuse users.
The mobile-first design loads quickly and works smoothly on small screens, which is essential for an app primarily used on phones. Fast load times and responsive design ensure customers can find answers without frustration.
Wikipedia Help
Wikipedia's main FAQ page exemplifies how text-heavy, comprehensive FAQs can remain effective. It conforms to the overall site design, which creates consistency across the user experience. The page is fully searchable both on-page and using browser search, with a clear list of 11 questions linked to answers lower on the page.
Wikipedia also maintains a FAQ index page listing 20+ different FAQs on the site. While it doesn't list all questions for every FAQ, it includes strategic keywords that quickly guide users to the right FAQ for any use case.
Nike
Nike's Get Help page demonstrates how minimalist design with active white space can improve scannability.
The interface uses clear calls to action (CTAs) and simplified navigation that guide users to answers without overwhelming them with options.
This “less is more” approach works particularly well for brands with broad customer bases, where clarity trumps comprehensive detail on the main FAQ landing page.
Microsoft Support
Microsoft's page for Microsoft 365 mixes content types including video tutorials, community forum integration, and traditional text-based FAQs. This multi-format approach accommodates different learning styles and complexity levels. The robust search and filtering capabilities help users navigate vast amounts of information.
The top questions section smartly pulls the most-asked questions from each category and places them at the top of the page. For companies with complex products, this organizational strategy ensures quick access to high-priority information.
Google Support
Google's support hub serves as a reference example for organizing vast amounts of information with clear visual hierarchy. The categorization system breaks down complex services into digestible sections, each with intuitive icons and descriptions. Users can drill down from broad topics to specific questions through logical pathways.
The design, layout, and information architecture demonstrate how to scale FAQ content without sacrificing usability. Even with thousands of help articles, users can find answers quickly through strategic organization.
Etsy
Etsy's help center showcases ecommerce-specific FAQ structure with clear segmentation between seller and buyer resources. The platform spotlights cornerstone content based on engagement data, ensuring the most valuable articles appear prominently. This data-driven approach prioritizes what customers actually need rather than what the company assumes they need.
Etsy's search functionality is robust, with filters that narrow results by user type, topic, and issue category. This makes the Help Center scalable as the marketplace grows more complex.
Spotify Community
Spotify's community-driven FAQ model combines official answers with peer support through user forums. This push-pull information access lets customers choose between verified company responses and community-sourced solutions. The voting system on community answers helps surface the most helpful responses over time.
Blending official FAQs with peer support creates a scalable support model where engaged users help answer questions. This approach works particularly well for consumer products with passionate user bases.
Brooklinen
Brooklinen's FAQ page exemplifies effective DTC ecommerce design with focus on product care, shipping, and returns. The on-brand design matches the rest of their website, creating visual consistency. Simple navigation uses expandable sections to keep the page clean while providing detailed answers when needed.
The emphasis on product care information demonstrates understanding of customer concerns post-purchase. Addressing how to maintain product quality builds confidence in the purchase decision.
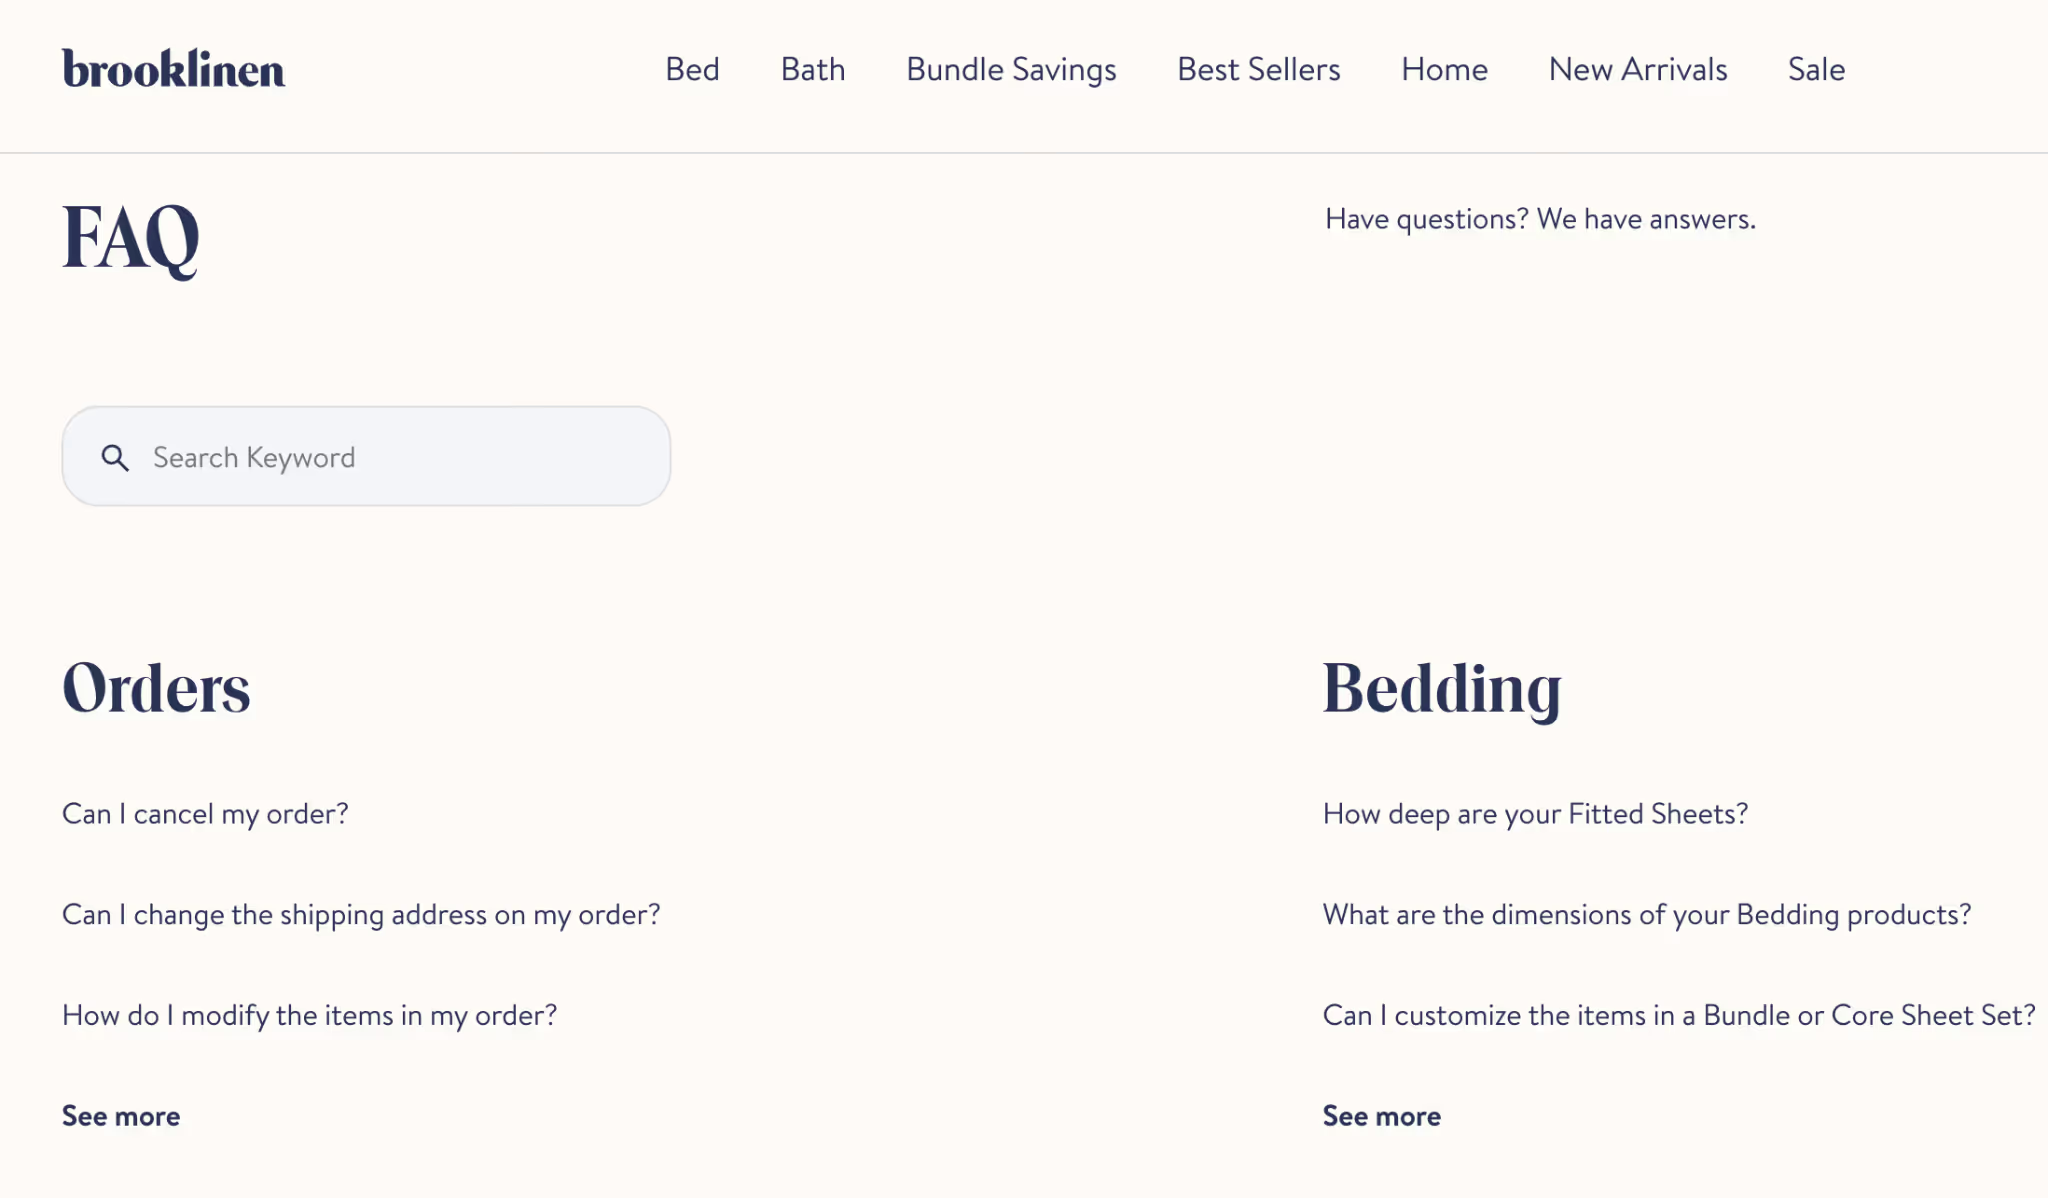
How to create an FAQ page
Building an effective FAQ page from scratch requires a data-driven approach. Follow these steps to create an FAQ that actually serves your customers and reduces support volume.
Identify top customer questions
Start by mining your support tickets, chat logs, and email conversations for recurring questions. Tag and categorize inquiries by intent to identify patterns in what customers ask most frequently. If you use Gorgias, our shopper intent detection automatically provides this information.
Supplement ticket data with competitive research, customer surveys, and on-site search queries. Focus on questions that appear more than once rather than edge cases that affect only a handful of customers. Look at data from the past three to six months to capture current trends.
Additional data sources include:
- Support tickets and chat transcripts
- On-site search queries
- Customer reviews mentioning confusion or questions
- Sales call recordings
- Social media comments and messages
Categorize by intent (shipping, returns, product)
Group questions into logical categories that match how customers think about their needs. Common categories include ordering, shipping, returns, account management, and product details. This categorization reduces cognitive load and improves scannability by letting users jump directly to relevant sections.
Use customer-facing language for category names rather than internal jargon. For example, use “Returns” instead of “Reverse Logistics” and “Shipping” instead of “Fulfillment.” Test your categories with a few customers to ensure the organization makes sense from their perspective.
Common category examples:
- Orders and tracking
- Shipping and delivery
- Returns and exchanges
- Account and billing
- Product information and care
- Technical support
Write concise, action-oriented answers
Answer the question in the first sentence, then provide supporting details if needed. Keep answers to two or three sentences maximum, linking to deeper resources for complex topics. Use active voice and simple language, avoiding jargon unless you define it first.
If you use Gorgias, AI Agent can auto-generate draft answers from existing Macros and Help Center content, giving you a starting point to refine.
Compare these two approaches:
- Bad example: “We have a comprehensive returns process that we've designed to be as customer-friendly as possible while maintaining our business requirements.”
- Good example: “You can return unworn items within 30 days for a full refund. Start your return by clicking the link in your order confirmation email.”
Add search + accordion UX
The accordion pattern uses expandable sections to reduce visual clutter while keeping all content accessible. Users see question headlines at a glance and can expand specific answers without scrolling past irrelevant information. This pattern works particularly well for FAQ pages with more than 10 questions.
Include a search bar for users with specific questions who don't want to browse categories. Mobile responsiveness is non-negotiable since many customers will access your FAQ from phones while shopping or awaiting deliveries.
UX best practices:
- Prominent search bar at the top of the page
- Expandable accordion sections for answers
- Clear category headings with visual hierarchy
- Mobile-friendly touch targets and readable text
- Fast page load times
Link to deeper resources
FAQ answers should be concise starting points, not comprehensive guides. When topics require detailed explanations, link to full Help Center articles, product pages, or contact forms. This keeps your FAQ scannable while ensuring customers can access depth when they need it.
With Gorgias, you can embed links to Help Center articles, product pages, or your live chat widget directly in FAQ answers. For complex topics, link to a full guide instead of cramming details into the FAQ. This tiered approach to information architecture serves both customers who want quick answers and those who need comprehensive detail.
FAQ page design and user experience (UX)
Search + accordion for scannability
The accordion pattern has become the standard for FAQ pages because it keeps the interface clean while making all content accessible. Users can scan question headlines without opening every answer, then expand only the sections they need. This reduces scroll length and gives customers control over their experience.
Search bar placement matters. Position it prominently at the top of the page with placeholder text that suggests how to use it. Implement keyword matching and autocomplete to help users find answers even if they phrase questions differently than you do.
Accordion benefits:
- Reduces page scroll length
- Keeps interface visually clean
- Lets users control their experience
- Works well on mobile devices
- Improves perceived load times
Accessibility and mobile readability
Use readable font sizes (minimum 16px for body text), sufficient color contrast ratios, and keyboard navigation support to ensure all customers can access your FAQ. Many customers have visual impairments or motor limitations that require assistive technologies. Following Web Content Accessibility Guidelines (WCAG) isn't just ethical, it expands your potential customer base.
Test your FAQ on mobile before publishing. Mobile users represent a significant portion of traffic, and FAQ pages must work smoothly on small screens. Check that buttons are large enough to tap accurately and text is readable without zooming.
Accessibility checks:
- Font size of at least 16px
- Color contrast ratio of at least 4.5:1
- Full keyboard navigation support
- Screen reader compatibility
- Touch targets at least 44x44 pixels
FAQ SEO and schema markup
Schema markup helps search engines understand your FAQ content structure, potentially earning rich results in search. While implementation requires some technical work, the SEO benefits make it worthwhile.
JSON-LD FAQPage markup (eligibility caveats)
FAQ schema is structured data that tells search engines which content represents questions and answers. It uses JavaScript Object Notation for Linked Data (JSON-LD) format, a lightweight markup language that sits in your page's code without affecting visible content. When implemented correctly, schema helps search engines parse your FAQ for AI Overviews and featured snippets.
Rich results are limited to government and health sites, but schema still improves SEO for all sites through better indexing and AI Overview inclusion. Even without rich results, search engines understand your content structure more clearly, which can improve rankings for question-based queries.
For complete implementation guidance, check out creating SEO-friendly FAQ pages, which walks through tactics like internal linking and keyword placement. Also see our guides on ecommerce SEO and creating ecommerce blog content that ranks on Google.
Track impressions/clicks in Search Console
Google Search Console shows how your FAQ page performs in organic search. Monitor impressions (how often your page appears in search results), clicks, average position, and click-through rate to understand which questions drive traffic. The URL Inspection tool validates your schema markup and identifies any implementation errors.
Key metrics to track:
- Search impressions
- Click-through rate
- Average position in results
- Top performing queries
- Schema validation status
Make your FAQ visible
Embed on product pages
Product-specific FAQs reduce pre-purchase friction by answering questions in context. Questions about sizing, materials, compatibility, and care instructions belong on product pages where shoppers are making buying decisions. Contextual FAQs address concerns before they become barriers to purchase.
If you use Gorgias Convert, trigger FAQ modals based on user behavior. If a shopper lingers on a product page, show a modal about sizing or shipping to address common hesitations proactively.
Reinforce at cart/checkout
Cart and checkout represent high-anxiety moments where FAQ content can prevent abandonment. Common questions at this stage include shipping costs, delivery times, and return policies. Link to your FAQ page prominently during checkout or embed critical answers directly in the checkout flow.
Consider adding an FAQ link in the cart sidebar or below the checkout button. This placement catches customers who hesitate before completing their purchase.
Surface via live chat/helpdesk
FAQ articles can be surfaced in live chat conversations before escalating to human agents. This deflects tickets while maintaining customer satisfaction since most customers prefer instant answers over waiting for an agent. With Gorgias, AI Agent auto-suggests relevant FAQ articles based on the customer's question, resolving issues before creating a ticket.
Surface FAQ articles in live chat to resolve questions before creating a ticket. This approach combines the efficiency of self-service with the personal touch of chat, creating a seamless experience.
Measure FAQ success
KPIs (engagement, conversions, search visibility)
Key metrics include page views, time on page, bounce rate, conversion rate, and search impressions. Track engagement in Google Analytics 4 (GA4) by setting up events for scroll depth, link clicks, and accordion expansions. FAQ pages should reduce bounce rate by providing answers that keep users on site rather than leaving to search elsewhere.
Set up GA4 events to track FAQ engagement. This data shows which questions get the most attention and which categories might need expansion or clarification.
KPIs to track:
- Page views and unique visitors
- Average time on page
- Bounce rate
- Conversion rate for visitors who view FAQ
- Search impressions and clicks
- Click-through rate from search
Ticket deflection ROI
Ticket deflection measures inquiries resolved via FAQ instead of creating support tickets. Calculate the value using this formula: tickets avoided multiplied by cost per ticket equals deflection savings. If your FAQ prevents 100 tickets per month and each ticket costs $5 USD to resolve, that's $500 USD in monthly savings.
Maintain and improve
Feedback loops (tickets, on-site search)
Monitor support tickets, on-site search queries, and customer feedback to identify FAQ gaps. New product launches, policy changes, and seasonal trends require FAQ updates to stay relevant. If you see the same question appearing repeatedly in tickets despite having an FAQ page, either the answer isn't clear or customers can't find it.
With Gorgias, use ticket insights and intent statistics to surface emerging questions that should be added to your FAQ. Review ticket data monthly to identify new FAQ topics and update existing answers that generate follow-up questions.
Feedback sources:
- Support ticket themes and trends
- On-site search queries with no results
- Customer surveys and feedback forms
- Product reviews mentioning confusion
- Sales team questions and objections
Update cadence and ownership
Schedule quarterly reviews of FAQ content to verify policies, refresh screenshots, add new questions, and remove outdated content. Assign ownership to your CX or content team to ensure accountability. Without clear ownership, FAQ pages decay over time as policies change and products evolve.
Outdated FAQs erode trust faster than having no FAQ at all. Customers who find incorrect information lose confidence in your brand and may abandon their purchase or leave negative reviews.
Example update checklist:
- Verify all policies are current
- Refresh screenshots and visual examples
- Add questions that appeared in recent tickets
- Remove content about discontinued products
- Update seasonal information (holiday shipping)
- Test all links to ensure they work
Build your FAQ page today
FAQ pages deliver immediate value through ticket deflection, improved conversion rates, and SEO visibility. The key is treating them as living documents that evolve with your business rather than static pages you build once and forget.
Gorgias makes FAQ implementation seamless, helping you turn FAQ pages into a strategic asset that reduces costs while improving customer experience.
Book a demo to see how Gorgias can transform your approach to self-service support.
{{lead-magnet-2}}
The Definitive Ecommerce Strategy Guide for CX-Led Growth
TL;DR:
- An ecommerce strategy is a structured plan connecting product, customer experience, and operations to measurable revenue and retention goals
- The three core pillars are product strategy (selection, pricing, positioning), customer strategy (personas, lifecycle marketing, service), and operational strategy (tech stack, fulfillment, data)
- A successful framework starts with goal-setting (OKRs, North Star metrics), then tech stack alignment, then content and SEO planning by funnel stage
- Omnichannel cohesion is required across all touchpoints, from a shopper's first interaction through post-purchase and retention.
- Conversational CX — through AI automation, Self-service, and personalized support — turns strategy into operational leverage and measurable outcomes.
An ecommerce strategy is a structured plan that connects your product assortment, customer experience, and operational systems to measurable revenue and retention goals. It matters now because customer expectations have shifted. Personalization, speed, and seamless experiences are table stakes.
At the same time, rising acquisition costs mean brands can't rely on traffic alone. They need to convert efficiently and retain relentlessly. A working strategy follows a clear framework: set goals, align your tech stack, and map content to each stage of the shopper's experience.
Customer experience is central to execution. Conversational AI, Self-service tools, and omnichannel support drive conversion, reduce churn, and create operational leverage that scales with your business.
{{lead-magnet-1}}
What is an ecommerce strategy?
An ecommerce strategy is a structured plan that connects your product assortment, customer experience, and operational systems to measurable revenue and retention goals. It's not a list of tactics. Strategy is the roadmap—the decisions about what you sell, who you sell to, and how you deliver value. Tactics are the actions you take to execute that roadmap.
Without strategy, brands chase one-off wins: a viral ad, a discount-driven spike, a temporary boost from paid social. With strategy, those same efforts compound. Every channel, message, and customer interaction reinforces the same goals.
A strong ecommerce strategy enables three critical outcomes:
- Acquisition efficiency: Lower customer acquisition costs (CAC) and higher conversion rates by targeting the right customers with the right messages at the right time
- Retention rates: Repeat purchases and customer lifetime value (CLV) growth through personalized experiences and proactive service
- Operational leverage: Automation, integrations, and self-service tools that scale support without scaling headcount
Core components (product, customer, operations)
Every ecommerce strategy rests on three interconnected pillars. They're not siloed—decisions in one area affect the others.
Product strategy defines what you sell, how you price it, how you source and manage inventory, and how you differentiate. It's informed by customer demand data, competitive positioning, and operational constraints like lead times and carrying costs.
Customer strategy defines who you sell to, how you acquire and retain them, and how you serve them. This includes buyer personas, lifecycle marketing, personalization, and service excellence. It's where conversion and retention battles are won.
Operational strategy defines how you fulfill orders, manage data across systems, and enable teams to execute. This includes your tech stack, order management, fulfillment workflows, and the integrations that make it all run smoothly.
Product strategy
Selection & sourcing
Product assortment decisions shape everything downstream, from marketing messages to fulfillment complexity. The challenge is balancing breadth (how many categories) with depth (how many SKUs per category).
Too much breadth dilutes focus. Too much depth increases carrying costs and stockout risk.
Stock keeping unit (SKU) rationalization is the process of identifying which products drive revenue and margin, and which create operational drag. Most brands find that a small percentage of SKUs generate the majority of revenue. The goal isn't to cut everything else—it's to be intentional about what you carry and why.
Sourcing considerations include:
- Minimum order quantities (MOQs) and lead times that affect cash flow and inventory flexibility
- Supplier reliability and quality consistency
- Cost versus margin trade-offs (lower cost doesn't always mean higher profit if quality suffers)
- Flexibility to adjust orders based on demand shifts
Customer demand data and voice of customer (VoC) insights should inform these decisions. What are customers asking for? What problems are they trying to solve? What gaps exist in your current assortment?
Pricing strategy
Pricing is positioning. It signals value, influences perception, and directly impacts unit economics. There's no single right model—the best approach depends on your market, competition, and brand positioning.
Common pricing models include:
- Cost-plus: Add a fixed markup to your cost of goods sold (COGS)
- Competitive pricing: Match or undercut competitors to win on price
- Value-based pricing: Price to the perceived value customers place on your product, not just your costs
- Dynamic pricing: Adjust prices based on demand, inventory levels, or competitive activity
Promotions and discounts play a role, but overuse trains customers to wait for sales. The most successful brands use discounts strategically—to clear inventory, reward loyalty, or convert hesitant first-time buyers—not as a crutch for weak positioning.
Dynamic pricing and unit economics (the profit or loss on each individual sale) become especially important as you scale. Small changes in pricing or cost structure can have outsized effects on profitability.
Branding & positioning
Brand positioning is how you want customers to perceive your brand relative to alternatives. It's not what you say about yourself—it's the distinct space you occupy in customers' minds.
To identify what makes your brand unique, look at three inputs: customer feedback, competitive gaps, and brand strengths.
Consistency across channels reinforces positioning. Visual identity, messaging tone, and customer interactions should all communicate the same value. A premium brand that delivers slow, impersonal support creates cognitive dissonance. A value brand that overinvests in packaging might confuse customers about what they're paying for.
Inventory management
Inventory is a balancing act. Too little, and you lose sales to stockouts. Too much, and you tie up cash in products that sit on shelves, accruing carrying costs.
Demand forecasting uses historical sales data, seasonality, and market trends to predict future demand. Safety stock is the buffer you keep on hand to account for demand variability or supply delays. Reorder points trigger new orders when inventory hits a predetermined threshold.
Inventory turnover and carrying costs are the two key metrics for inventory efficiency. Inventory turnover measures how many times you sell through your inventory in a given period.
Key inventory KPIs include:
- Inventory turnover rate (sales divided by average inventory)
- Stockout rate (percentage of time products are out of stock)
- Carrying cost as a percentage of inventory value
Inventory data also prevents stockouts and overstock situations that erode profitability and customer trust.
Differentiation & VoC feedback loop
Customer feedback doesn't just inform service—it shapes product development. Voice of customer (VoC) data includes support tickets, chat transcripts, product reviews, and survey responses. It's a direct line to what customers want, need, and struggle with.
Use VoC data to identify gaps (features customers ask for that you don't offer), opportunities (unmet needs in the market), and validation (whether a new product idea resonates). Conversational data sources—support interactions, chat logs, social comments—are especially valuable because they capture unfiltered, real-time feedback.
The best brands close the loop: they collect feedback, act on it, and communicate changes back to customers. This builds trust and signals that you're listening.
Customer strategy
Buyer personas & segmentation
Buyer personas are semi-fictional profiles representing your ideal customer types. Segmentation is the process of grouping customers by shared characteristics or behaviors. Both help you tailor messaging, offers, and experiences to specific customer needs.
Build personas using behavioral data (what customers do) and demographic data (who they are). Behavioral data—browsing patterns, purchase frequency, channel preference—often predicts outcomes better than demographics alone.
Segment-specific strategies might include different email messaging for first-time buyers versus repeat customers, or different product recommendations based on past purchases. The goal is relevance at scale.
Key persona elements include:
- Demographics: age, location, income level
- Behaviors: browsing habits, purchase frequency, channel preference
- Pain points: the problems they're trying to solve
- Goals: the outcomes they want to achieve
Personalization & lifecycle marketing
Lifecycle marketing tailors messages and offers to where customers are in their journey with your brand. It's not one-size-fits-all communication—it's contextual, timely, and relevant.
The five lifecycle stages are:
- Awareness: discovering your brand for the first time
- Consideration: evaluating your products against alternatives
- Purchase: making a first buy
- Retention: coming back for repeat purchases
- Advocacy: recommending your brand to others
Personalization enhances each stage. In awareness, it might mean serving content based on browsing behavior. In consideration, showing product recommendations based on items viewed. Post-purchase, sending replenishment reminders based on purchase history.
Data sources for personalization include browsing behavior, purchase history, and support interactions. One study finds that 70% of marketers using advanced personalization see an ROI of 200% or more for their efforts.
Retention has been the talk 2022 but I only see it becoming more important in 2023, with brands seeking out ways to truly differentiate their retention experience. It's not enough to have just a post-purchase flow; what are you really doing to personalize the customer experience from order 1 all the way through the course of their life with your brand?
— Brandon Amoroso, Founder and President of Electriq Marketing
Engagement & retention programs
Repeat customers are 300% more valuable than first-time shoppers, thanks to behaviors like higher average order values (AOV), referrals, social sharing, and reviews. Retention programs formalize the path from one-time buyer to loyal advocate.
Common retention tactics include:
- Loyalty programs: points-based systems or tiered programs that reward repeat purchases
- Subscription models: recurring revenue that increases predictability and CLV
- Exclusive access: early product drops, VIP perks, or members-only content
Engagement channels—email, SMS, push notifications—keep your brand top of mind between purchases. The key is frequency and relevance. Too much communication feels like spam. Too little, and customers forget about you.
Customer lifetime value (CLV), churn rate, and retention rate are the metrics that matter. CLV predicts total revenue from a customer over their entire relationship with your brand. Churn measures how many customers stop buying. Retention measures how many come back.
"Consumers are being more picky with their purchases as cash simply isn't stretching as far, so brands will have to work harder to prove their value. Businesses themselves are also having to navigate smaller budgets, so with customer acquisition prices soaring, it makes sense to switch the focus towards existing customers."
— Georgie Walsh, Content Marketing Manager at LoyaltyLion
CX foundations (navigation, search, PDPs)
Site UX fundamentals determine whether visitors convert or bounce. Navigation structure should be clear and intuitive—minimal clicks to key categories. Search functionality needs autocomplete, filters, and relevant results. Product detail pages (PDPs) require high-quality images, detailed specs, customer reviews, and clear calls-to-action.
Customer experience affects both conversion and retention. A smooth first purchase builds confidence. A frustrating checkout creates abandonment. Given that online shopping cart abandonment rates sit at around 70%, removing friction at every step matters.
Self-service options—Help Centers, FAQ pages, chatbots—reduce the effort customers expend finding answers. They also reduce support volume, freeing your team to focus on complex issues.
Service excellence (SLAs, Self-service)
Service excellence is meeting or exceeding customer expectations for speed, accuracy, and empathy. Given that 54% of customers will leave a brand after just one bad experience, it's essential for retention.
Service-level agreements (SLAs) define response time expectations. First response time—how quickly you acknowledge a customer's message—and resolution time—how quickly you solve their issue—are the two metrics customers care about most. 42% of customers say they're willing to pay more for a friendly, welcoming experience, and 65% say that a positive experience with a brand is more influential than great advertising.
Self-service options reduce support volume and improve convenience:
- Help Center: searchable articles covering common questions
- AI agent: Instant answers and automated order actions like tracking and cancellations
- Automation: Ticket routing, Macros, and workflows that speed resolution

Source: ALOHAS
Service quality builds trust. Trust drives repeat purchases. The relationship is direct and measurable.
For a more in-depth analysis of what defines excellent customer service, read our guide to 20 customer service best practices.
Ecommerce strategy framework
Goals & KPI tree (OKRs, North Star)
Objectives and key results (OKRs) are a goal-setting framework where objectives are qualitative goals (what you want to achieve) and key results are quantitative milestones (how you'll measure progress). A North Star metric is the single metric that best predicts long-term success—revenue per visitor, CLV, or monthly active subscribers, depending on your business model.
KPI hierarchy flows from the North Star down. Your North Star metric is supported by primary KPIs (conversion rate, AOV, retention rate), which are supported by secondary metrics (traffic sources, email open rates, support resolution time). This structure clarifies which metrics matter most and how they connect.
Common ecommerce KPIs by category:
- Acquisition: conversion rate, customer acquisition cost (CAC)
- Revenue: average order value (AOV), gross merchandise value (GMV)
- Retention: customer lifetime value (CLV), repeat purchase rate
- Service: Net Promoter Score (NPS), customer satisfaction (CSAT), average handle time (AHT)
Measurement without iteration is pointless. Use data to test hypotheses, identify bottlenecks, and optimize continuously.
Tech stack audit & integrations
Your tech stack is the set of tools and systems that power your ecommerce operations. A well-integrated stack enables data to flow between systems, automations to run smoothly, and teams to work efficiently.
Core tech stack components include:
- Platform: Shopify, BigCommerce, or custom builds
- Helpdesk: Gorgias or alternatives for customer support
- CRM: customer data platforms for segmentation and personalization
- Enterprise resource planning (ERP): systems for inventory, financials, and supply chain
- Order management system (OMS): software for fulfillment, shipping, and returns
- Analytics: tools for tracking behavior, attribution, and performance
Integrations matter because disconnected systems create manual work, data silos, and errors. An API (application programming interface) enables systems to communicate. Composable commerce—building your stack from best-of-breed tools rather than an all-in-one suite—gives flexibility but requires strong integration infrastructure.
"As brick-and-mortar storefronts open up again, a unified customer service across all channels will be important. The unification of systems, operations, experience, and service with composable architectures will set a brand up for success in the next decade to come."
— Steve Krueger, CEO and Founder at JIBE
Content and SEO plan by shopper awareness stage
Content serves different purposes at different funnel stages. Map content types to customer intent:
- Awareness: blog posts, guides, educational resources, social content
- Consideration: product comparisons, customer reviews, case studies, buying guides
- Conversion: product detail pages, checkout copy, guarantees, trust signals
- Retention: email campaigns, loyalty program content, post-purchase communications
Search engine optimization (SEO) drives organic traffic and lowers acquisition costs over time. Keyword research identifies the terms customers use when searching for solutions. On-page optimization ensures your pages are structured and written to rank. Technical SEO addresses site speed, mobile-friendliness, and crawlability.
Content also plays a role in self-service and customer education. Help Center articles, video tutorials, and FAQ pages reduce support volume while improving customer confidence.
Shopper experience & omnichannel
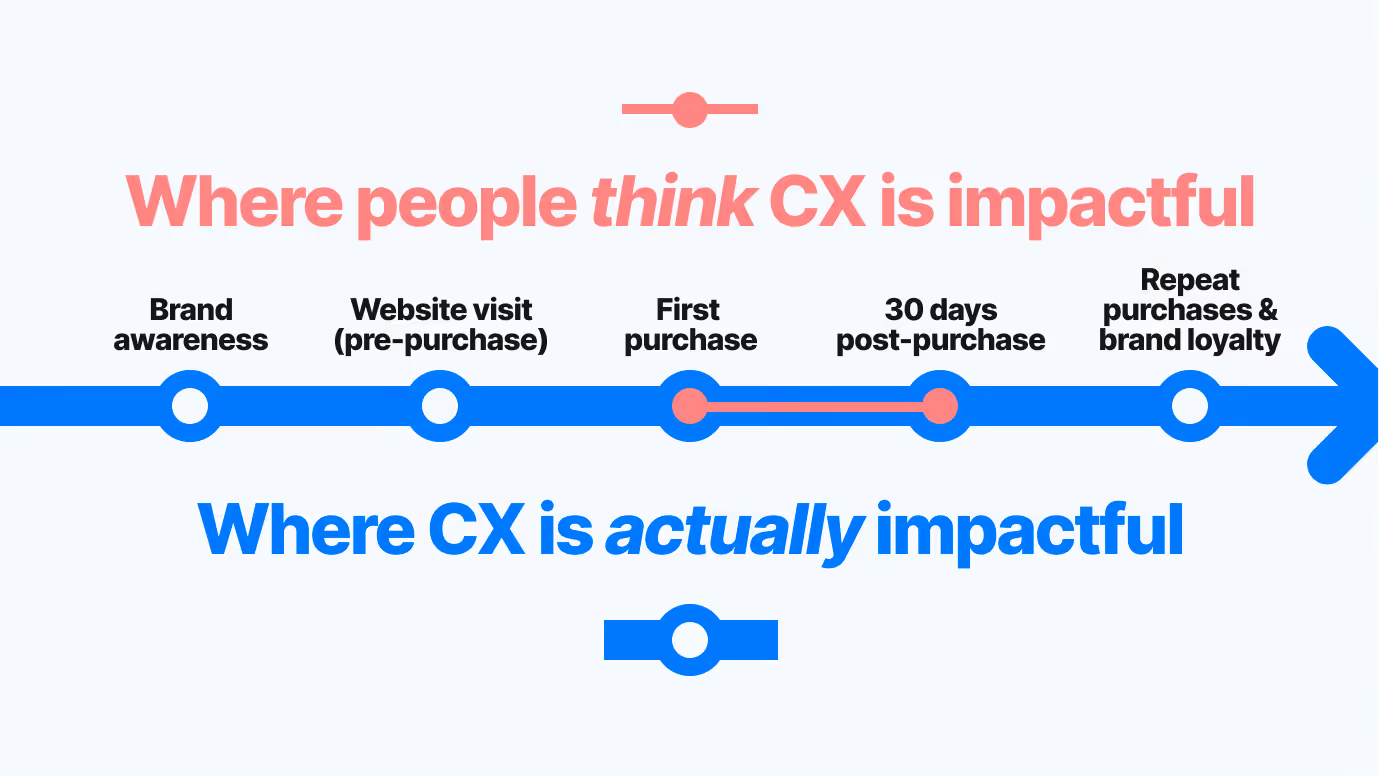
Channel cohesion across touchpoints
Omnichannel is a seamless customer experience across all channels and devices. Channel cohesion is the consistency in messaging, data, and functionality across those touchpoints. When done well, customers move between channels without friction—starting a conversation on Instagram, continuing it via email, and completing a purchase on your website.
Consistency matters because customers don't think in channels. They think in problems and goals. If your brand voice shifts from playful on social to formal in email, or if your support team can't see a customer's chat history when they call, the experience feels disjointed.
Unifying customer data across channels requires integration. Your helpdesk should pull order history, browsing behavior, and past interactions into a single view so agents have full context.
Key touchpoints include:
- Website (desktop and mobile)
- Mobile app
- Social media (Instagram, Facebook, TikTok)
- Chat (live and AI-powered)
- Voice (phone support, voice assistants)
By providing multiple ways for customers to contact your support team, you make your support services more convenient and accessible. Omnichannel customer service entails offering support via channels like email, SMS, Live Chat, and social media.
Post-purchase & OMS experience
The post-purchase experience includes every touchpoint after the buy button: order confirmation, shipping updates, delivery, and returns. It's where satisfaction is cemented or eroded.
Post-purchase touchpoints include order confirmation emails or SMS, shipping notifications with tracking links, delivery notifications, and a returns portal with clear policies and refund timelines. The order management system (OMS) orchestrates fulfillment—routing orders to the right warehouse, updating inventory, and syncing tracking data back to the customer.
Fulfillment efficiency affects customer satisfaction. Late shipments, incorrect orders, and complicated returns create support volume and churn. A smooth post-purchase experience, on the other hand, drives retention and advocacy. Customers who feel taken care of come back and refer others.
Turn your ecommerce strategy into action with conversational CX
Conversational CX—AI-powered automation, self-service tools, and omnichannel support—is what turns strategy into operational leverage. AI Agent automates repetitive inquiries like order tracking, return status, and product availability, freeing your team to focus on complex, high-value conversations. Help Centers enable self-service at scale, letting customers find answers on their own time. Omnichannel support meets customers where they are, whether that's Instagram DM, email, or live chat.
The result is speed, personalization, and efficiency. Faster response times improve satisfaction. Personalized interactions build trust. Operational leverage lets you scale support without scaling headcount.
If you want to start creating an optimized experience for your customers that will drive customer loyalty and grow your store's sales, Gorgias can help.
See how Gorgias helps brands execute their ecommerce strategy with conversational CX. Book a demo today.
{{lead-magnet-2}}