


Newsletter Signup
The best in CX and ecommerce, right to your inbox
Featured articles
Ticket Volume: How to Measure It, Benchmark It, and Reduce It
Gorgias AI Agent Pricing, Explained
Introducing Helpdesk 2.0: Built for How Agents Work
TL;DR:
- Built directly from agent feedback, Helpdesk 2.0 fixes real workflow pain points. The redesign focuses on reducing friction and helping agents handle more context-heavy tickets.
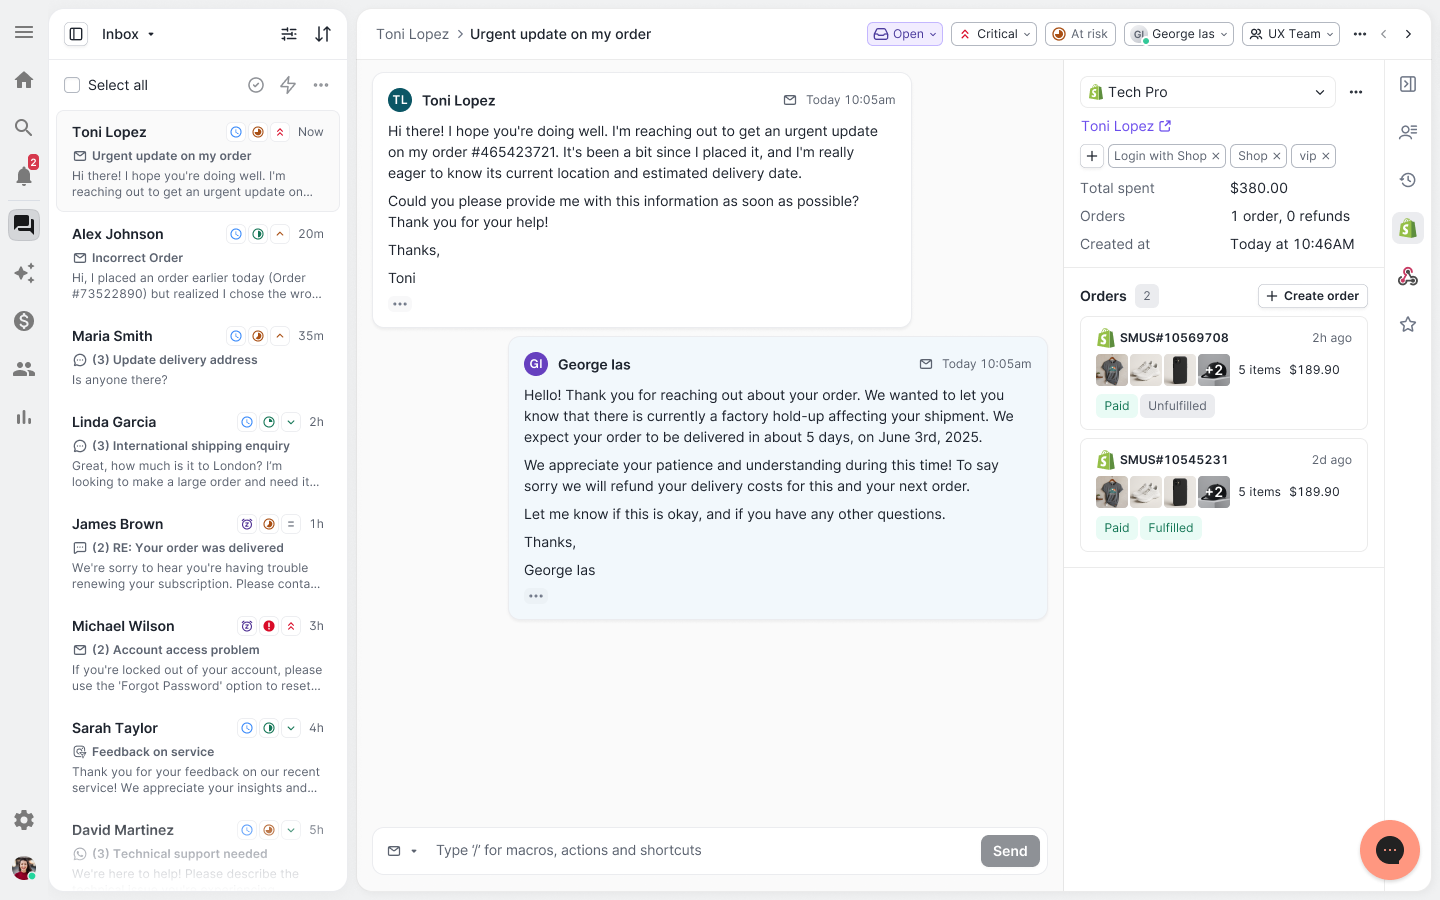
- A chat-style interface replaces the old email layout. Conversations are easier to follow and resolve in one view.
- Customer context is shown beside the conversation in a right-side panel. Agents can view history, orders, and details without leaving the ticket.
- AI handoffs come with clear summaries. Agents instantly see what happened, what was tried, and what to do next.
- Navigation is simpler and faster across teams. Clean menus, structured queues, and multi-store access keep agents moving efficiently.
Helpdesk 2.0 starts with the people who use it most: the agents.
We spent time understanding customer support from the agent's seat. What do they reach for constantly? What slows them down? What does a better workday look like?
Everything we found is in this brand-new update.
Why we redesigned Helpdesk
Conversational commerce is the new standard.
In customer support, this means customers expect context to remain intact wherever they reach out, whether a conversation starts on social, moves to email, or ends on a call.
This new approach to support has also changed the agent's role. Recurring tickets, like order status checks, shipping updates, and returns, are now handled by AI. What lands in the agent inbox are edge cases that require human judgment and troubleshooting, or tickets that require the full picture.
However, the original Helpdesk was built for a different era of support.
Context was separated across views rather than built into the conversation itself. It's something one in five Gorgias customers flagged, through support tickets, NPS surveys, and conversations with our team. So, we got to work.
Helpdesk 2.0 is the result.
What's new in Helpdesk 2.0
Here's a look at everything that changed.
Read conversations the way they're meant to be read
Conversations have a natural rhythm, one that’s already found in every messaging tool we use. We brought that same layout into the helpdesk.
Say goodbye to the 2000s email interface and hello to chat bubbles. This updated design changes how quickly you can orient yourself and resolve the ticket in one go.
Chats with customers now look like real conversations, using the speech bubble style you’re familiar with on popular messaging apps.
Check customer history without losing your place
Checking a customer's history used to mean leaving the conversation, an extra step that interrupted what should have been a smooth workflow.
Now, past conversations open in a sidebar next to the active conversation. You can view a customer’s full history, search through their timeline, and open prior tickets without going to a new page.

Check past conversations, orders, and customer details in the brand-new Customer Timeline.
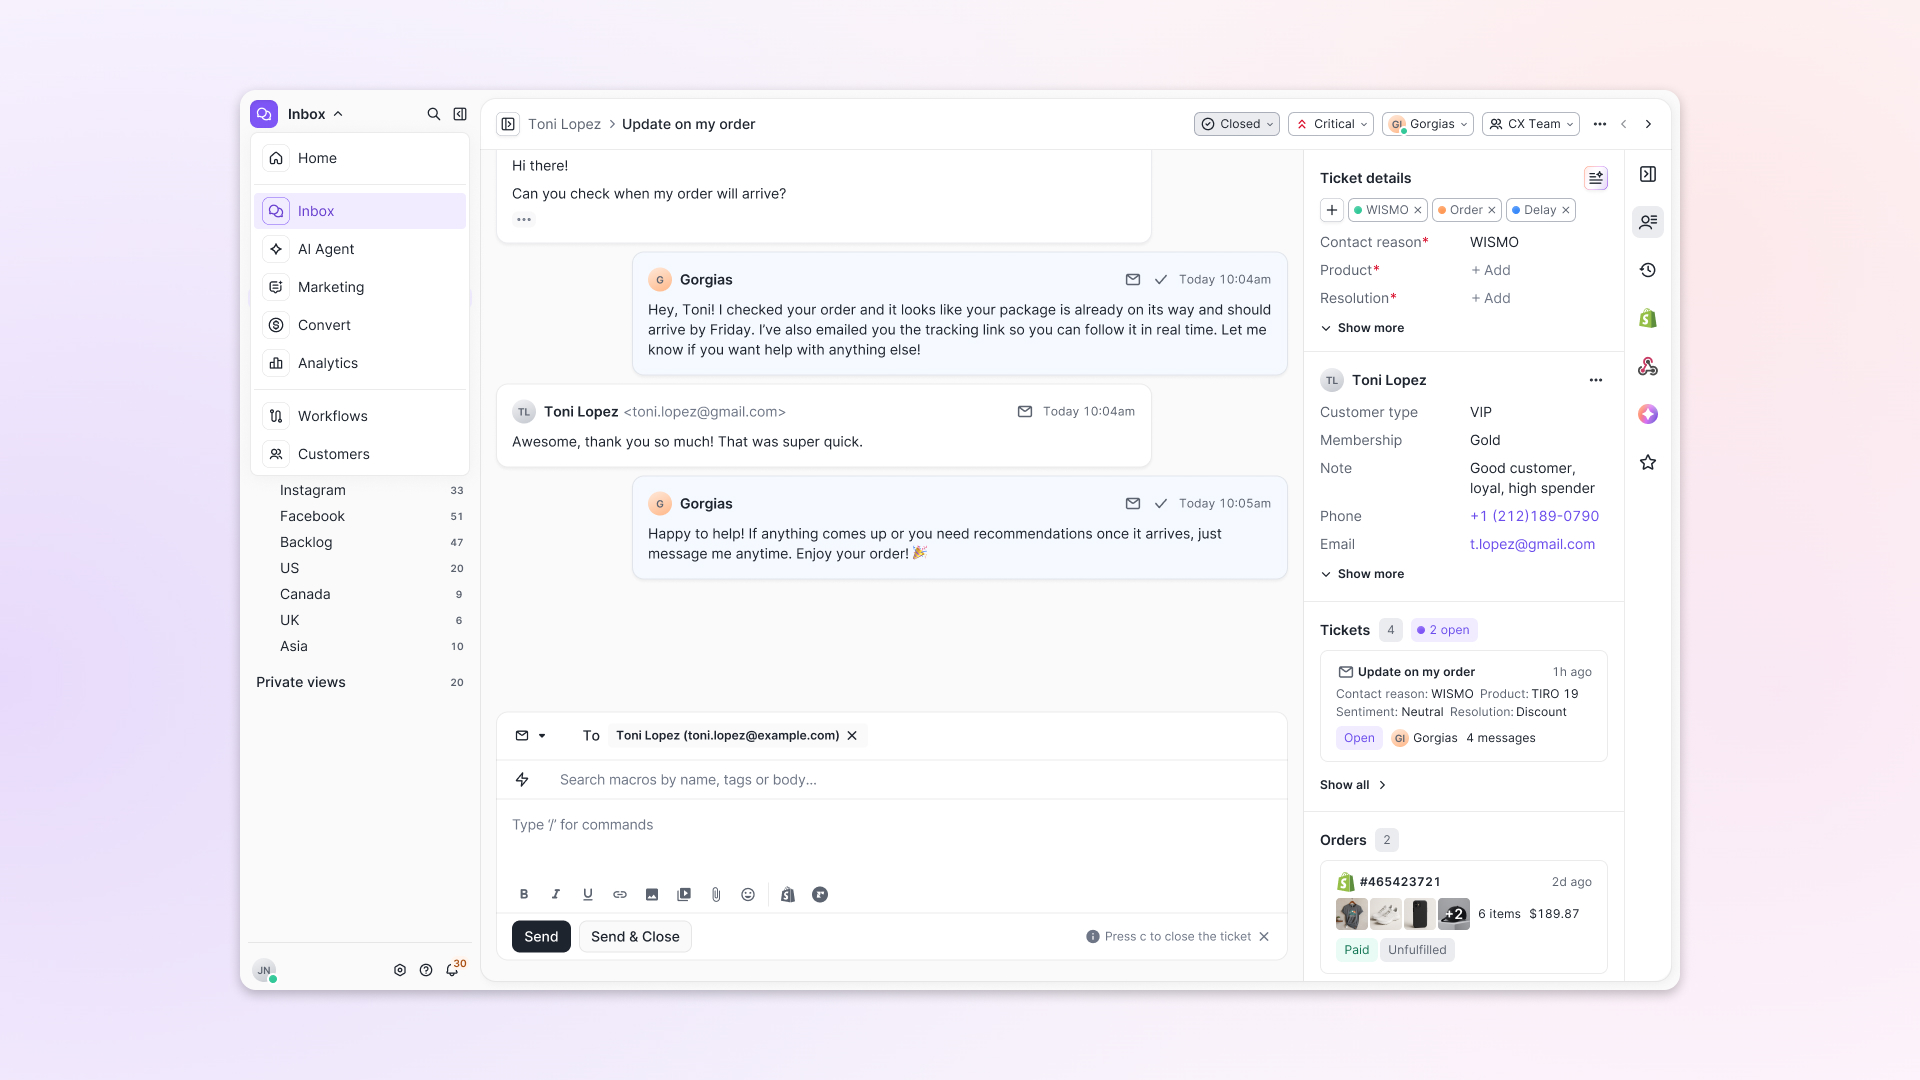
See order details the moment you open a ticket
Order information is easier to reference than ever. Open a ticket, and you instantly see the customer's recent orders, marked with product images and invoice details at a glance. Need to dig deeper? Click on an order, and the expanded information appears in the same panel.
For teams using custom integrations, apps are fixed in a quick-access integration menu on the right.
See order details, product images, and totals at a glance on the right panel, without leaving the conversation.
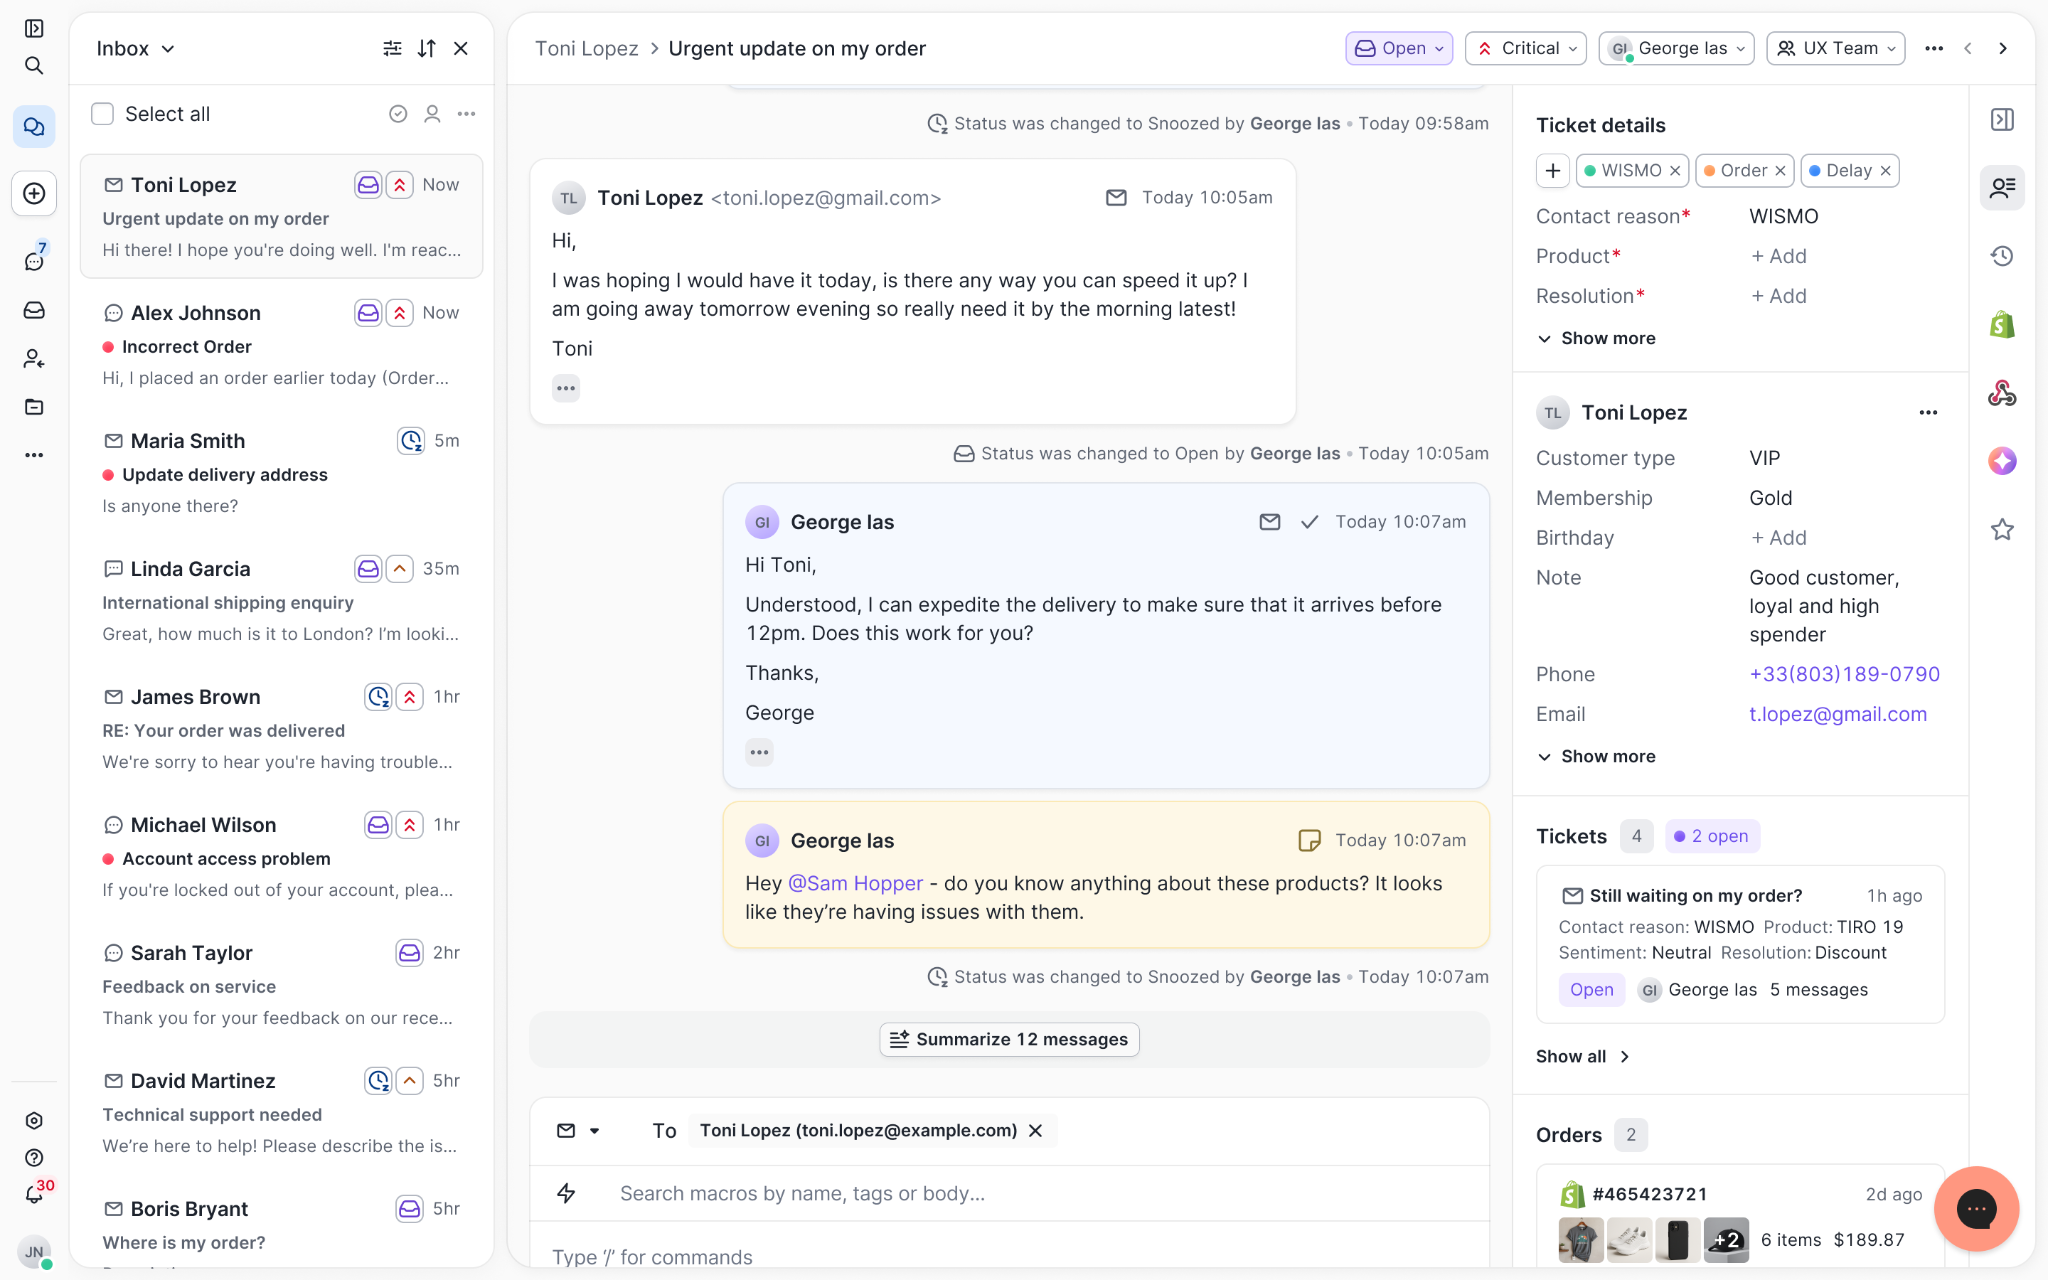
Pick up where AI left off
You shouldn't have to dig through a thread to figure out what AI already tried. Now you don't have to.
When AI Agent escalates a conversation, it includes a concise handover summary that mentions the issue, what actions were taken, and why it was passed to your team.
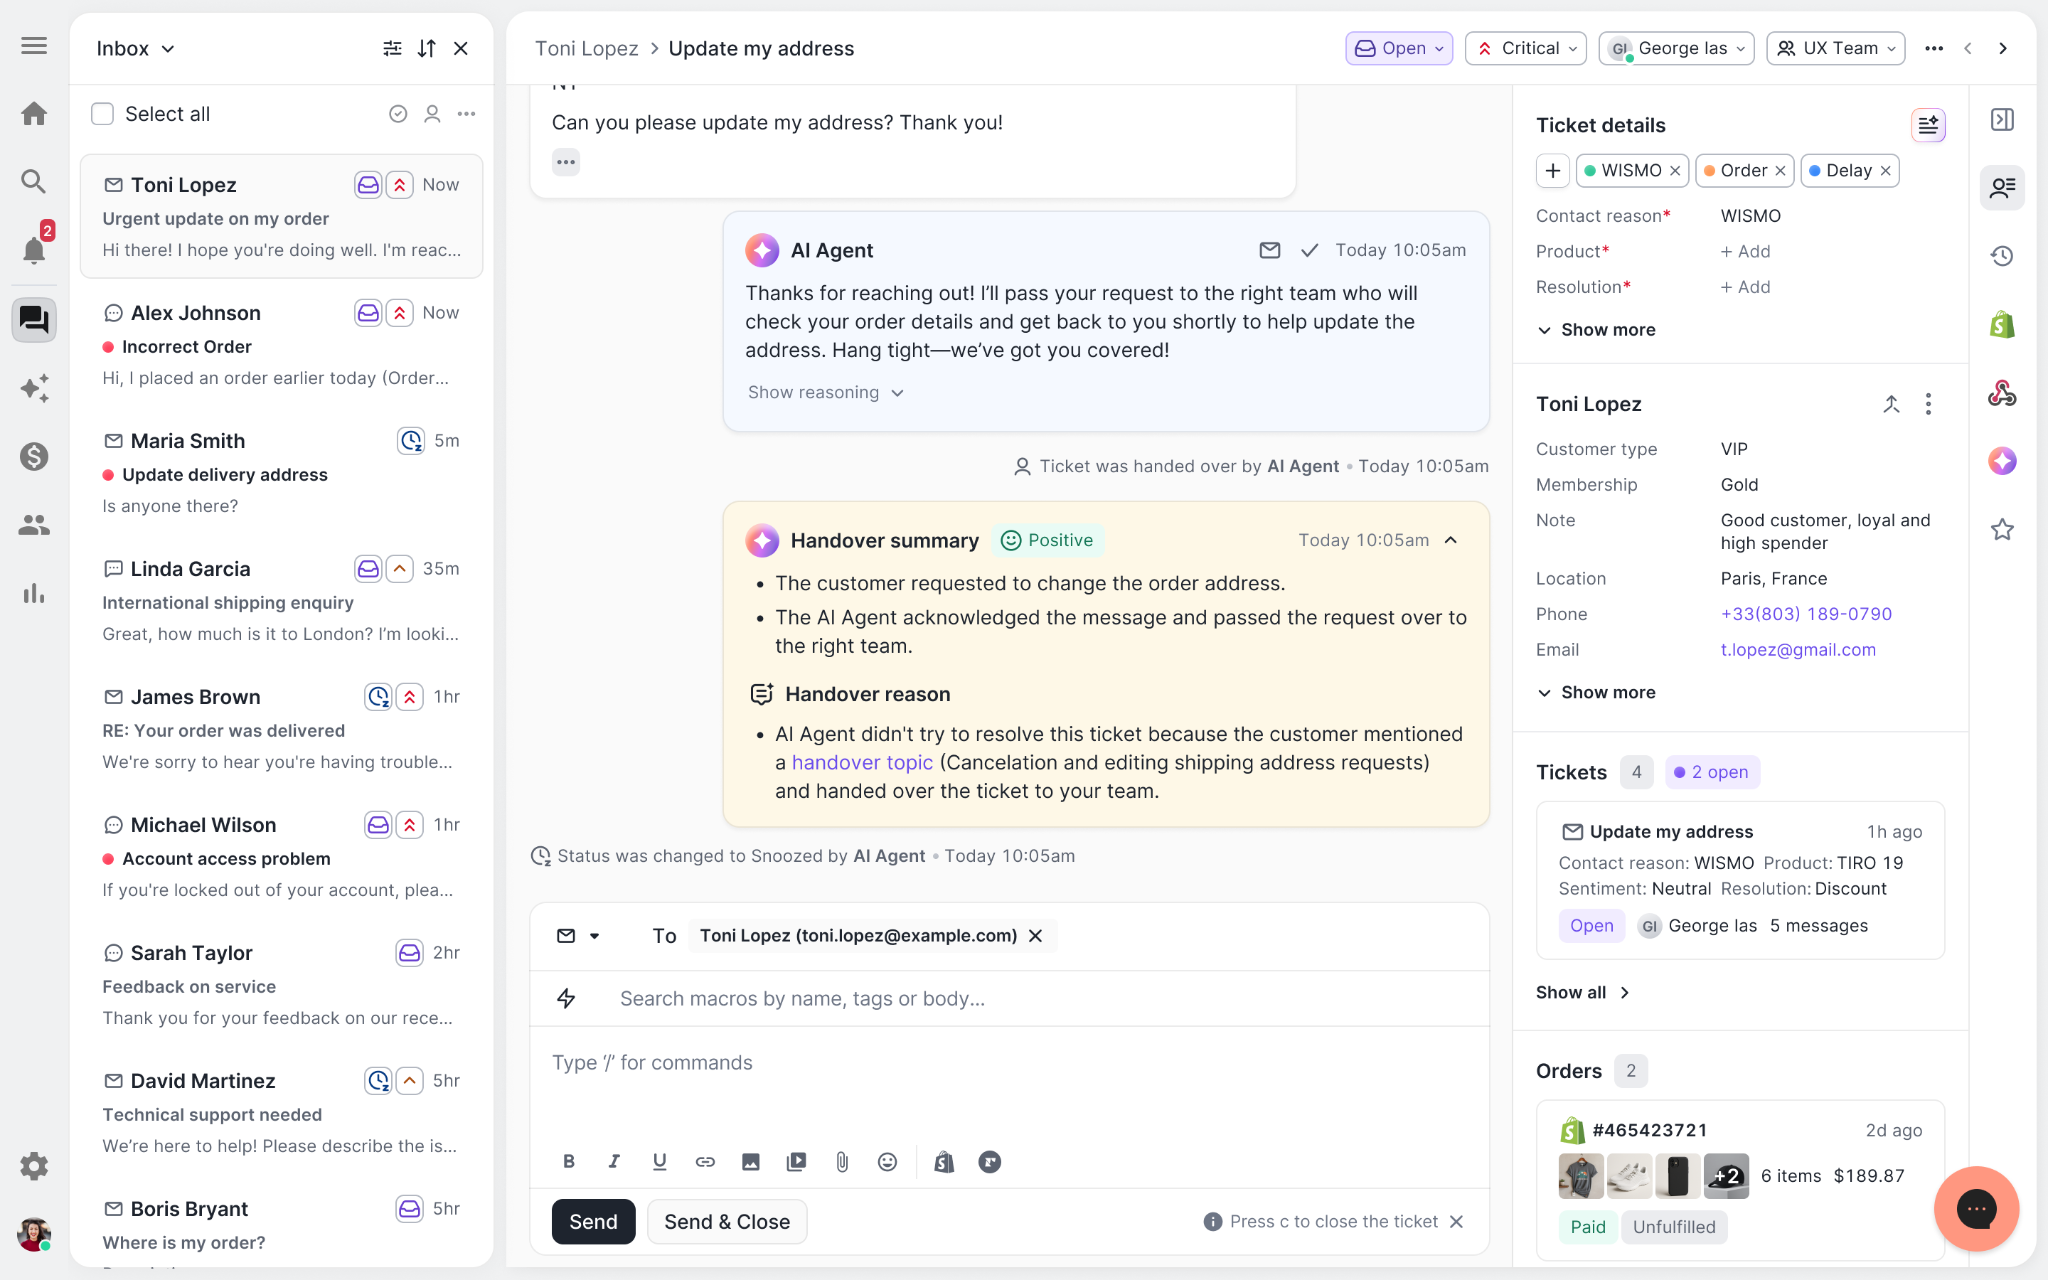
Escalated tickets include a brief AI-generated handover summary, marked in yellow, for quick reference.
Move faster across every store and team
We restructured and simplified the navigation. The left sidebar organizes everything into clear categories: Inbox, AI Agent, Marketing, and Analytics, so anyone on your team knows exactly where to go.
To quickly update your knowledge base or adjust a workflow, both now live right in the sidebar. For teams managing multiple stores, switching between them is just as straightforward, accessible from the sidebar, so agents can move between inboxes without breaking their flow.
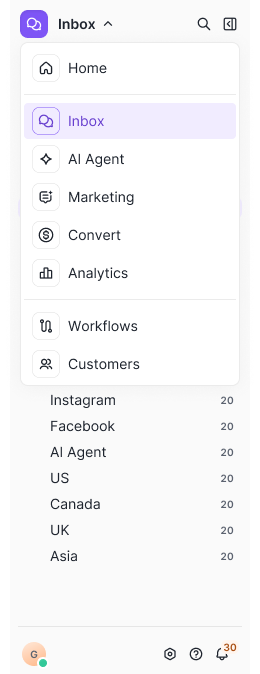
Agents can switch between stores and their corresponding inboxes directly from the left menu.
A workspace that works the way agents do
Support comes down to the person on the other end of the conversation. We built Helpdesk 2.0 is to make sure they have everything they need to show up for that moment.
The best way to see the difference is to work in it. Start a free trial today.


Further reading

Ecommerce Launch Checklist: 15 Essential Steps to Win
You went back to check your store and noticed an error in the checkout page settings, preventing customers from making payments on your store.
Do you think you would experience the moment of dread in that situation?
I bet you would.
When you’re launching an online store, there are many details to remember—and those details can make or break your business's success.
However, by having a rock-solid ecommerce launch checklist in place, you can eliminate errors and rid yourself of “dread” moments forever.
The following checklist will help you figure out the key things you need to get ready when launching your online store. Think of it as a quality-assurance check for your ecommerce launch.
Let’s jump in.
The 15 step ecommerce launch checklist
- Get the core pages of your online store set up
- Design listing pages
- Create product pages
- Make a shopping cart page
- Put together a checkout page
- Check on your ecommerce SEO
- Optimize your website for conversions
- Add essential apps to your store
- Install an ecommerce helpdesk
- Set up email marketing
- Connect your sales channels
- Set up analytics
- Develop an ecommerce marketing plan
- Integrate payment methods
- Run ecommerce testing
1. Get the core pages of your online store set up
Your ecommerce website is where customers will visit to learn more about what you’re offering. It’s also where shopping activities happen.

Hence, ensure your website includes these most recommended standard pages:
- Home page: This is arguably the most important page on your website. A well-designed homepage should tell what your business is all about and your unique value proposition. It should also include links to product pages and category pages on your store.
- About page: This is where customers learn about the people behind your products. A good About page should tell your brand story and what you stand for. It should also include trust elements to prove your store is real and credible.
- Contact page: Ensure you display your phone number, email, and real physical address (if any) on the Contact page. Make it clear about how customers can get in touch with you to showcase your authenticity.
- Frequently Asked Questions (FAQ) page: Customers might have a lot of questions before deciding to buy from you. Having an effective FAQ page will help you offer a self-service solution to customers and avoid answering the same questions repeatedly.
- Terms of service: This page covers your legal base, what’s included, and what’s not in your services.
- Privacy: As concerns about data breaches are increasing, it’s highly recommended that you work with a lawyer to draft a clear privacy policy for your ecommerce business.
- Shipping, return and refund: Nearly half of the consumers check an online store’s return policy before making a purchase. That’s why having a dedicated shipping, return, and refund page on your website is crucial. Doing that is also an excellent way to build trust with your potential customers.
A worthy note is that your ecommerce website doesn’t have to include a blog page. It depends on your marketing strategy, product types, and target audience (more on that later).
2. Design listing pages
A listing page or a category page is where customers discover your products associated with a specific category. It’s useful for keeping your website coherent and helping customers find what they’re looking for quickly. You can take listing pages to a whole new level by using them to increase conversions and enhance your overall SEO.

Ensure you include the following elements in your listing pages:
- A short introduction to your category.
- Filtering and sorting functions
- Best sellers and reviews.
- Stock availability.
- Product quick view.
- Internal linking among categories and sub-categories.
3. Design product pages
Product pages are where the buy buttons show up. But they’re also where many other things can go wrong: lack of trust, unclear information about products, etc. That’s why each product page must be optimized as much as possible.

Keep in mind the following:
- Display the add to cart button prominently. Above the fold is an ideal place because it’s at customers’ reach at all times. Also, make it stand out by using contrast colors.
- Use high-quality, professionally crafted pictures from different angles. Enable product image zoom and 360-degree view features in your theme.
- Write a solid product description. Focus on the benefits of your products, not just features. In other words, how your products make customers’ lives easier and better.
- Check product-related components, including styles, sizes, colors, inventory tracking numbers, tax rates, currency, product weights, etc.
- Establish trust with customers by displaying trust badges, reviews and testimonials, or other social proof types.
4. Design shopping cart page
The shopping cart is where shoppers review their selected items and make the purchasing decision. The goal of this page is to lead shoppers to the checkout page.
Follow these tips to create an effective shopping cart:
- Display product details, including product names, images, sizes, colors, and prices clearly. This helps shoppers remember their selected products and why they want to have them.
- Use a clear, attention-grabbing call-to-action (CTA) button, for example, “Proceed to Checkout” or “Go to Checkout.”
- Make the cart easily editable, like removing items, changing size/color/quantity, etc.
- Display social proof to maintain trust with shoppers and avoid unexpected shipping costs/taxes/hidden costs.
- Add a mini cart widget. It’s a good idea because shoppers can add products to their cart without leaving the page they’re on.
{{lead-magnet-1}}
5. Design checkout page
The checkout page is where cart abandonment often happens. So ensure you review it carefully as much as possible.

Remember these to build a high-converting checkout page:
- Offer various popular payment options like credit cards, master cards, PayPal, Amazon Payments.
- Keep it simple. Don’t include too many steps or fields—the goal should be to help customers finish the payment process faster.
- Include an option to check out as a guest.
- Display a progress bar at the top of the page to tell shoppers how many more steps are left to complete the purchase.
- Include a live chat throughout the checkout process to quickly support customers.
- Show order confirmation after purchase. The best practice is to create a Thank You landing page to confirm the order and give them special offers for the next purchases.
6. Check ecommerce SEO
Many ecommerce websites rely on social media or paid advertising to drive conversions. They ignore entirely or put together with little consideration of search engine optimization (SEO).
But ecommerce SEO is worth investing in because 44% of people start their online shopping journey with a Google search. Also, 37.5% of all traffic to ecommerce sites comes from search engines.

Keep in mind the following:
- Do keyword research and find the most relevant keywords to your niche.
- Use selected keywords to optimize meta titles, descriptions, H1’s, URLs.
- Insert selected keywords into product descriptions and category descriptions.
- Add schema markup to get rich snippets displayed in Google, which can increase CTR by up to 30%.
- Remove or fix duplicate content.
- Link to high-priority pages like product pages and category pages.
- Create and submit a sitemap.
- Optimize website loading speed by upgrading your hosting, investing in a CDN, and optimizing image file size with compression.
Recommended reading: SEO for ecommerce, Dominate Google in 10 Easy Steps.
7. Optimize website for conversions

Shinesty
On an ecommerce website, conversions are critical. Check out the following to make sure your store is optimized for high conversion rates:
- Use videos to demonstrate your products.
- Show live chat to address shoppers’ concerns and answer their questions faster.
- Make your website user-friendly and fully responsive on mobile devices.
- Display countdown timers and/or stock countdowns to give shoppers a little push to take action.
- Optimize menu navigation. Make it super easy for shoppers to find whatever they need.
- Ensure site search works well, not just product information but also related products, delivery times, return policies, and more.
- Make information about your products and services easily findable and visible.
- Use a “sticky” buy button so shoppers can easily proceed to checkout whenever they’re ready to place an order.
- Enable the Pin It button so shoppers can share your products on their Pinterest wishlists.
8. Install essential apps for your store

Every ecommerce platform offers an app store filled with amazing apps to extend your commerce store’s functionality and grow your business. That’s why you should find the most essential apps and install them into your store:
Here are some app types you should consider:
- Apps for marketing and promotion.
- App for increasing sales and conversions.
- Apps for sales channels.
- Apps for SEO and site optimization.
- Apps for finding products and managing inventory.
- App for customer service (more on that later).
9. Set up an ecommerce helpdesk
Good customer service means better customer retention and more sales. That’s why choosing the right helpdesk is crucial for your online business. It’ll not only help you provide the best customer support, increase engagement, and convert more sales in the process but also seamlessly integrate with your current ecommerce platform.
For ecommerce businesses, Gorgias is an ideal solution as it’s an ecommerce-dedicated ticketing system and has tight integration with Shopify, BigCommerce, and Magento.

Here is what Gorgias offers:
- Update orders directly from your helpdesk and work faster with smart automation.
- Manage customer requests for multiple storefronts, either on desktop or mobile apps.
- Use Shopify and BigCommerce variables to auto-respond order-related tickets.
- Integrate with third-party apps like ShipStation, Slack, and Recharge.
- Use macros to automate tasks and perform actions like adding tags, bulk action.
- Provide instant support by setting rules based on customer intents.
- Deliver omnichannel customer service, e.g., SMS messaging and social media.
- Easy to use, no learning curve involved, no feature overload.
- Impartial customer support for all merchants, regardless of the plans you’re using.
10. Set up email marketing

Using email marketing is one of the best ways to develop and maintain a good relationship with customers. If your ecommerce business hasn’t taken the time to adopt email marketing, you’re likely leaving money on the table.
Here are the eight most important emails for ecommerce:
- Welcome emails: Thank shoppers for joining your email list, set expectations for what’s to come.
- Thank you emails: Thank shoppers for buying from you and reassuring them they’ll receive the order on time.
- Survey emails: Send customers an email to ask for their feedback on shopping experience and their experience with your products.
- Card abandonment email: Encourage customers to complete their purchase if they leave items in their carts.
- Order confirmation emails: Confirm with customers the order they just made in your store.
- Upsell and cross-sell emails: Sell customers additional products to increase your store’s average order value.
- Promotional offer emails: Tell your customers about your site-wide discounts, holiday offers, free gifts, etc.
- Customer loyalty and re-engagement emails: Send emails to existing customers or customers who haven’t purchased from your store in a specific timeframe.
11. Connect with sales channels
The U.S. now has over 230 million active social media users, with nearly 7 million added in 2019. That doesn’t mention the fact that ecommerce sales are heavily influenced by social media. Since your customers are very likely already on some social platforms, you might want to go where they are.

Keep the following in mind:
- Create a blog page and regularly share content relevant to your products.
- Establish your presence on social media like Instagram, Facebook, TikTok, Pinterest, etc.
- Follow influencers in your niche, read their followers’ comments to see what people are interested in and how you can integrate it into your products.
- Build a list of branded and non-branded hashtags to use in your social media posts.
- Get your products and brand features on price comparison websites, review websites, relevant forums, communities, Quora, etc.
- Display your website on handmade and crafts marketplace, on-demand production marketplace, niche marketplace, classified listings website, daily deals sites, Yellow Pages, etc.
Recommended reading: Master Social Media Marketing for Ecommerce in 10 Easy Steps
12. Set up analytics
It’s essential to set up analytics tracking and monitoring from day one because doing that will give you valuable insights into your visitors and customers.

Your ecommerce platform has its own set of analytics reporting built-in, but you may also want to consider trying these tips:
- Set up your Google Analytics in Google Tag Manager.
- Register and verify your site with Google Search Console.
- Verify checkout tracking.
- Customize tracking campaigns using URL Query String Tags.
- Filter bots and spiders.
- Set up Facebook Analytics.
Also, be sure you understand the importance of the following ecommerce metrics:
- Sales conversion rate
- Email opt-ins
- Customer lifetime value
- Customer acquisition cost
- Revenue by traffic cost
- Average order value
- Shopping cart abandonment rate
- Net Promoter Score
13. Develop an ecommerce marketing plan
The secret to ecommerce success isn’t just to get your products out there and see how they perform. You need a marketing plan to bring your products to potential customers and convince them to buy.
Without a marketing plan, you might miss out on the fact that “More and more brands are competing for the same eyes. Facebook’s algorithm rewards video and motion-based creative that are more likely to hook your audience quickly. And customers are also more demanding, impatient and curious than ever before,” as Scott Ginsberg, Head of Content, Metric Digital says.
Ensure your marketing plan includes:
- SMART (Specific, measurable, achievable, relevant, and time-bound) goals and objectives.
- Target customers, personas, and markets. You have to have a clear understanding of who you’re targeting, what characteristics define them, and where they’re located. Also, be sure you know their purchasing power and behaviors.
- Channels, tactics, tools to execute your plan. Pay-per-click advertising, SEO, content marketing, influencer marketing, social media marketing, or email marketing—list out everything you’ll do to achieve your goals in detail.
- A holiday marketing calendar that shows important holidays and events of the year. It’s also much better if you have a holiday marketing plan in place—the sooner, the better.
14. Integrate payment methods
One of the best ways to reduce abandoned carts is by providing as many payment methods as possible since everyone has different preferences.

Consider integrating these payment options:
- Credit and debit cards, bank transfers, prepaid cards.
- Digital wallets like PayPal, ApplePay, Google Pay. If you’re selling to China, WeChat should be considered.
- Buy now, pay later. It’s a growing trend, especially among millennials and Generation Z.
- ACH (Automated Clearing House). This method gives you greater control over payments and increases payment accuracy. Your customers also receive their purchases faster since ACH payments are processed quickly.
Regarding credit cards, you need to set up payment authorization to capture payment from your customers. You can do this by accessing your ecommerce platform admin. For example, in Shopify, you can set up automatic or manual capture of credit card payments. Shopify Payments provides an authorization period of 7 days.
15. Run ecommerce testing
To avoid errors and remove common online shopping hassles, you need to carefully test your ecommerce website before launching it. Also, run continuous A/B testing to identify what makes your customers happy and what brings conversions to your store.
Ensure you do the following tests:
- A/B test everything about your CTA buttons.
- Test multiple CTAs per page against one CTA per page.
- Test ecommerce apps’ functionalities and social media integrations.
- Test payment method functionalities.
- Check compatibility with web browsers.
- Test mobile responsiveness.
- Check performance and SEO-related things.
- Test websites, including homepage hero images, search button, all pages, pop-up forms, account pages, site loading speed, site security, and more.
- Test email marketing sequences.
- Test orders on mobile and desktops.
Use this ecommerce launch checklist to get your store ready!
This ecommerce launch checklist represents a roadmap for online merchants looking to start their business from scratch. Mastering the basics, and you’ll avoid all the hassles along the way.
Let’s wrap up:
- Prepare standard pages
- Design listing pages, product pages, shopping cart page, checkout pages
- Check ecommerce SEO
- Optimize website for conversion
- Install essential ecommerce apps
- Set up an ecommerce helpdesk
- Set up email marketing
- Connect with sales channels
- Set up analytics
- Develop an ecommerce marketing plan
- Integrate payment methods
- Run ecommerce tests
And once your store is up and running, check out these 13 ecommerce growth tactics to take your store to the next level.
Looking for a customer support app for your ecommerce store? Sign up for a Gorgias account and enjoy all the premium features for free in 7 days. Gorgias is an ecommerce-focused helpdesk solution that will help you create the best experience for your customers, improve your support team’s performance, and eventually drive sales.
{{lead-magnet-2}}

.avif)
How to Write Customer Service Policies for Ecommerce
As you hire more customer service agents, providing quality support across the entire team becomes a major challenge. Without clear rules, agents may each handle key tasks — like building self-service resources or handling refund requests — in different ways.
Fortunately, a good customer service policy helps avoid these problems. But to be truly effective, your policy needs more than platitudes like “Be friendly” or “Respond quickly.” Instead, it should include specific and actionable information.
In this guide, we’ll help you create a useful customer service policy by sharing the five key topics it needs to cover. We’ll also discuss how to write and enforce your policy.
First, let’s start with the basics. Or, you can skip straight to the advice for writing a useful policy.
What is a customer service policy?
A customer service policy is a document containing a set of guidelines, rules, and standards for customer service teams. Its goal is to help agents handle day-to-day tasks and set benchmarks for great customer service.
How and where are customer service policies used?
Customer service policies are among the first documents provided to new agents during their training. They act as cornerstone documents for a business's entire customer service team, since agents can use them during difficult or process-heavy interactions, like customer complaints, order cancellations, and so on.
A customer service policy is an internal document, so you won’t share it publicly. However, you can use it as a foundation and repurpose parts of it into various customer-facing policies (like cancellation or refund policies). These policies help you set customer expectations and reduce repetitive inquiries like "What's your return policy?"
Take a look at how Marine Layer does this in a concise way:

You can share these customer-facing policies in:
- FAQ pages (like the example above) and help center documentation
- Transactional emails: For instance, emails that confirm an item has shipped from the warehouse and includes order tracking and a clear return policy
- Terms and conditions that people sign when becoming customers: These documents usually have sections dedicated to customer-facing policies around refunds, returns, order cancellations, and so on.
Customer service policy vs service-level agreement (SLA)
While similar, customer service policies and service-level agreements (SLAs) are not the same.
Customer service policies are internal documents that help agents by setting standards and policies. Service-level agreements (SLAs) are external documents that define the expected level of service between a business and its customers. Use an SLA to communicate information like:
- Your support team’s business hours
- Your estimated response and resolution times
If you have SLAs, your policy needs to reference them, as you’ll see in a bit.
For a real-life example, check out Berkley Filters’ Contact page:

Above, Berkey listed the working hours for two of their support channels, as well as their average response time. This is a clear promise to customers that sets their expectations for the level of service provided by Berkley Filters.
The importance of having a customer service policy
While customer service policies vary for each company, they bring some key benefits to all organizations. Specifically, they:
- Help customer service agents do their job. A clear, easy-to-find policy lets agents quickly find the rules they should follow in any given situation. This saves them a lot of time and effort since they don’t have to come up with (or remember) what they should do on the fly.
- Ensure consistent support for every customer. Without a policy, agents can interpret identical situations differently, resulting in inconsistent service. A good policy nips this problem in the bud and guarantees that customers get the same level of care across the board.
- Establish standards and expectations for the customer service team. A key outcome of the policy is defining what “quality customer service” is — how fast service reps should respond, how quickly they should resolve issues, and so on. This provides agents and their managers with an objective measure for evaluating performance.
{{lead-magnet-1}}
When should you create a customer service policy?
Even if you're a customer service team of one, we recommend laying the foundations of your customer service policy as early as possible.
Here’s why:
You, and any agents you hire, will be faced with some situations over and over, regardless of business size or industry. The sooner you set the rules for these scenarios, the better your chances of providing consistent service, avoiding confusion, and setting standards for your team.
For online stores, these common situations are:
- Item exchanges
- Order cancellations
- Refund and return requests
- Damaged goods and missing package complaints
Team members who handle customer inquiries should know how to deal with these from day 1.
Outside of these situations, you should continue to expand your policy as your customer service team grows. That’s a major aspect of ensuring consistent, high-quality service across a larger team. We’ll discuss some additional policy topics in the next section.
What to include in your customer service policy [checklist]
Some elements of the customer service policy will vary depending on company size and industry. For example, a clothing brand's return policy will be different from that one for a brand that sells perishable goods.
However, pretty much all policies should cover the following 5 key topics below.
1) Steps for handling common customer service workflows
This is the most important part of your customer service policy. It empowers agents with the knowledge they need to resolve customer issues and provide quality support.
Here are some common workflows to include in this section:
- Refund and return requests. Agents need clear instructions on how to act when buyers request refunds or want to return an item. For example, if the request comes in within your policy’s timeframe (say 15 days after the purchase) agents should give a no-questions-asked refund. Some businesses allow refunds and returns for repeat shoppers even after the deadline, so don’t forget to list all exceptions to this rule.
- Order cancellations. At a minimum, your policy should state how much time buyers have to cancel an order after placing it. Allowing cancellations until an item ships out of the warehouse is a simple way to handle this.
- Damaged goods complaints. Online stores usually specify a timeframe in which damaged goods claims have to be filed (e.g., 2 days after the item was received). If the complaint was made on time, agents should explain how to return the product and what to expect next. Some businesses even offer buyers a choice between exchanging their item or keeping it with a small discount when the damage is small.
- Shipping problems. Lots of factors can result in an order being delivered after the deadline you promised (or not being delivered at all), so agents must know how to handle these situations. Offering credit to the customer’s account is a commonly-used practice here.
- Item exchanges. Your policy should clearly state which items buyers can exchange and under what conditions. For example, custom items (e.g., with a person’s name) usually can’t be exchanged, while generic ones can be exchanged with others in the same category and price point.
- Dealing with angry customers. We’ve discussed how to handle these situations in our article on dealing with angry customer emails. Most importantly, instruct agents to read the complaint carefully, acknowledge the customer’s problem, and don’t let the situation affect their emotions. Also, make sure to lay out guidelines for escalation, when a manager should be involved in the conversation.
As you can see, there are many scenarios to consider here. Fortunately, once you’ve outlined them, you can easily build a library of message templates around your common processes, so your agents don’t have to waste time typing from scratch.
Gorgias’ version of templates, called Macros, include variables that automatically populate with each customer’s unique information (like names, order numbers, shipping information, and more). This means you may be able to simply pull up and send the relevant Macro without any copy/pasting.

You can also put information about these key policies in useful self-serve resources like FAQ pages or a help center. These empower visitors to instantly resolve simple issues themselves, instead of flooding your team with repetitive tickets (and having to wait for a response).
2) Guidelines for prioritizing customer inquiries
This is another crucial topic for your agents’ day-to-day that every customer support policy should include. Without prioritization rules, agents can follow their own prioritization logic, resulting in poor response times for urgent tickets.

Here are three prioritization factors to include in your policy:
- Inquiry channel. If you’re using messaging channels, consider prioritizing them to meet the built-in expectations for fast responses. As a rule of thumb, real-time channels like SMS and live chat should be answered within a few minutes, while emails should be answered within a day.
- Request urgency. Say a customer reports a bug that prevents them (and potentially other shoppers) from completing a purchase. Regardless of the channel, these types of inquiries should take priority over more generic questions.
- Customer type. You want to keep your best customers happy with priority service. On that note, consider that repeat shoppers generate 300% more revenue than new customers, as we mentioned in our Customer Experience Growth Playbook.

We have lots of useful advice on this topic, so check out our detailed guide to prioritizing customer service requests.
3) SLAs and customer service standards
As we mentioned, SLAs are customer-facing promises about your team's response and resolution times. This information should also be in your policy, so agents are aware of the expectations your SLA sets.
But what if you don’t have an SLA? Well, your agents still need to what standard they’ll be held to, i.e., what “good customer service” means for your company.
That’s why your policy needs to establish a set of customer service metrics or key performance indicators (KPIs), regardless if you have an SLA or not.
First Response Time (FRT) is the primary metric to consider here.
FRT measures how long your agents take to respond to customer inquiries, on average. You can have different FRT targets, depending on the channels you use. For example, a 1-hour FRT might be great for email support, while 1-2 minutes is usually a good target for live chat and SMS.
As Brianna Christiano, Director of Support at Gorgias explains:
“We actually have members of the support team who monitor FRT every hour. This allows us to keep a pulse on our workload and pivot if necessary. If we notice that live chat or SMS inquiries are getting overwhelming, we’ll ask team members who typically do, for example, email support to help with the live messaging channels so we can maintain a low FRT.”
Also, you can use FRT to nudge buyers to try a specific customer service channel.
Let’s take another look at Berkley Filters’ Contact page:
Besides setting expectations, making the average response time public helped Berkley Filters push more buyers toward their new SMS channel.
Other useful metrics for your policy include:
- Average Resolution Time (ART): How long your customer service team takes to resolve tickets, on average. To calculate it, you first need a specific time period to analyze, like one week or a month. Then, add up the length of all resolved conversions during that period. Finally, divide that number by the number of customer conversations you had during the same period.
- Customer Satisfaction Score (CSAT): A measure of how satisfied visitors are immediately after an interaction with a customer service agent. You can collect feedback by running customer surveys with a question like “On a scale from 1 to 5, how satisfied are you with your experience today?” Then, to calculate your CSAT, divide the positive customer feedback (4- and 5-star responses) by the total customers and multiply the result by 100.

- Support Performance Score. This is a metric we created for our team at Gorgias and share with merchants to get a single snapshot of their team’s performance. It combines average first response time, average resolution time, and CSAT. The result is a score between 1 and 5, representing the team’s (or an individual agent’s) performance.

4) Tone of voice and acceptable language
Your support team may be the only direct point of contact with your business for many customers. That’s why it’s crucial to establish that agents’ tone of voice should match the brands’ — whether that’s professional, friendly, or a mix of both.
But this is a pretty broad rule that can be difficult to apply in real-life situations. You also want to add clear examples of what fits within your tone of voice guidelines and what doesn’t.
For instance, starting customer interactions with an energetic tone can be a good foundation. However, agents should adapt to each customer’s tone after the initial contact. After all, annoyed visitors likely won’t respond well to humor or light-hearted conversation.
Also, make sure to add an exhaustive list of words for your agents to use and avoid. For instance, agents shouldn’t sound overly apologetic when discussing fixed company policies (refunds, order cancellations, etc.) with customers. You can instruct them to avoid apologetic language and instead use empathetic — but not overly apologetic — phrases to communicate the facts.
If you use different customer support channels, it’s a good idea to include specific guidelines for them. For instance, call-center agents can be instructed to:
- Periodically reassure people that they’re listening
- Speak clearly without rushing or raising their voice
- Give people enough time to explain their problems
Of course, apply these same tone-of-voice considerations to any customer support templates or self-service resources. All of these are an extension of your brand, and ensuring consistency at the source is mission-critical.
5) Rules for proactive customer service
Customer service is much more than responding to tickets. Proactive customer service — where agents make the first move, instead of waiting for people to contact them — can help you exceed buyers’ expectations, drive revenue, and reduce repetitive questions.

If you haven’t tried proactive customer service, here are some ideas you can test and describe in your policy:
- Reach out to shoppers with items in their carts. This is one of the best ways to reduce cart abandonments. To pull it off, you need a helpdesk like Gorgias to detect shoppers who linger on specific pages — like a product page or checkout page. Learn more about how chat campaigns help you spark conversations with customers and unblock sales.
- Welcome new followers on social media with a direct message (DM). This can be as simple as thanking them for the follow. Or, you can let them know they can use the chat to ask questions. Learn more about this tactic (and how it can raise overall revenue by 4%).
- Create self-serve resources and send them to visitors. Based on Statista’s survey, 88% of customers expect brands to have self-service resources. Think FAQ pages or a help center that groups resources by topic. Making these resources available and prominently displayed makes the customer experience more convenient (and reduces repetitive support tickets that may currently be flooding your support inbox.)
Learn more about the best customer service software on the market and how it can help streamline your customer service operations and boost revenue.
How to write a useful customer service policy (outline template)
Before you dive into the policy’s content, make sure to name your document in a clear way, i.e., “Customer Service Policy” or “[Brand Name] Customer Service Policy”.
No need to get creative with the name. You just need people to be able to find it fast when they need it.
Before diving into writing the policy, consider that it should only cover topics that are specific to the customer service team. Broader topics (like code of conduct or other employee rules) should be part of larger company handbooks or other high-level documents, so the customer service policy doesn’t lose its focus.
In terms of content, it can be useful to separate the policy into two parts.
1) Information about the company’s mission, values, and products
This first section lays the foundation for the rest of the policy. Your company’s values and mission statement are a common place to start.
For example, Abel Womack — a material handling company — begins the public-facing version of their company’s policy by saying that it “has been established to be reflective of our shared values”, which are integrity, empathy, customer care, and teamwork.

Some policies also include details about the company’s products at this stage. If you sell various complex products, it can be useful to add that information. If not, you can skip it and move on to the meat of the policy.
2) Rules, guidelines, and standards for your customer service team (outline template)
The second half contains actionable information that helps agents provide excellent customer service.
Writing this part can be tricky, especially if you haven’t done it before. Fortunately, an outline makes the process much easier, compared to starting with a blank page.
Feel free to copy the outline below, which is based on the checklist from the previous section.
1) Steps for handling common workflows
- Refund and return requests
- Order cancellations
- Damaged goods complaints
- Follow-ups
- Dealing with angry customers
📚 Useful Resources: Our free refund and return policy generator & Loop Returns, which automates the returns process.
2) How to prioritize customer inquiries
- Factors that determine priority
- Examples of urgent inquiries
- Examples of non-urgent inquiries
📚 Useful Resources: Best practices for prioritizing customer service requests.
3) SLAs and customer service standards
- Company SLAs
- KPIs for live chat support
- KPIs for SMS support
- KPIs for email support
- KPIs for phone support
📚 Useful resources: Detailed guide on evaluating customer service & 25 key customer support metrics.
4) Tone of voice
- Guidelines for written communication (live chat, SMS, email)
- Guidelines for verbal communication (phone support)
- Rules for providing proactive customer service
- Contacting visitors with items in their cart
- Self-serve buyer resources
📚 Useful resources: Our guide on proactive customer service & customer self-service ideas
From here, it’s all about filling in the specifics using your brand’s terminology e.g., “customer service representatives”, instead of “customer service agents”, and so on.
{{lead-magnet-2}}
Practical tips for enforcing your customer service policy
So, you’ve done the hard work of creating a detailed and actionable customer service policy. Now, let’s get agents to actually use it.
First and foremost, ensure the document is easy to find by:
- Putting it in your Google Drive, knowledge base, or wiki.
- Making it a part of the mandatory customer service training.
Also, keep in mind that the policy shouldn’t be a static document. Instead, it needs regular updates as you add new products, team members, and support channels. Entrusting a customer service team member, likely a manager, to keep it updated is a must.
Another key tip for improving enforcement is tying the policy to the metric(s) you use to evaluate agents’ performance. This will keep people accountable and give you an objective way to determine their adherence.
Here’s an example of this idea in action by Brianna Christiano, Director of Support at Gorgias:
“At Gorgias, we use an internal quality metric to gauge the support team’s performance. Each week, managers audit 3 of their agents’ tickets and determine the quality and efficiency of the provided service, based on that metric. This lets us continuously evaluate and reinforce customer service rules and standards.”
Finally, getting managers to shadow new agents is another best practice here. This lets managers reinforce your policy from day 1. Plus, it’s a useful way to check if new agents can satisfy customers’ needs.
Next steps: Evaluate your policy’s impact
After weeks of writing, introducing a new policy to the team feels great. But getting the document out there is only half the battle.
You then need to monitor if the policy is helping you reach your customer service goals.
To do that, keep a close eye on your support metrics (FRT, ART, and so on) in the weeks after the initial implementation.
It’s also crucial to determine if your new policy is truly customer-centric. This means tracking feedback metrics, like CSAT and other customer satisfaction metrics that have a major impact on customer retention.
The evaluation process is as important as creating the policy, so be careful not to overlook it. For additional practical tips, check out our guide to evaluating customer service programs.

10 Best Returns Management Tools for Fast, Cost-Efficient Returns [2024]
TL;DR:
- An ecommerce returns automation tool streamlines the returns process by automating return requests, payment processing, and customer updates.
- Choose a tool with ecommerce platform and app integrations, analytics, and a self-service portal.
- ReturnLogic is the best returns management tool, providing a return portal, inventory management, and powerful analytics dashboards.
Managing product returns is often one of the most significant expenses of running an online store. Data from Invesp shows that 30% of all products purchased online are returned, compared to just 8.89% of products purchased from brick-and-mortar retailers.
There are several reasons why returns are so common in ecommerce — the most prominent listed in the image below. But regardless of the reason, the bottom line is that your store's bottom line depends on an optimized returns process.
%2520(1).webp) |
We’ve already discussed how you can optimize your returns process, but most growing stores need additional help. Thankfully, there are plenty of returns management software tools on the market today that are designed to reduce the expense of returned products without harming customer satisfaction.
In this article, we'll explore what to look for in great returns management software before highlighting the nine best returns management tools available today.
{{lead-magnet-1}}
What is returns management?
Returns management is the process of helping customers who need to return an item, whether online to an ecommerce shop or in person at a brick and mortar store. Typically, customers submit a return request, send or bring an item back, and the business restocks the item and credits back the customer.
What is ecommerce returns automation?
Ecommerce returns automation is a tool that manages the returns process for online stores using automation and AI.
Instead of relying on manually managing returns and refunds, automation software minimizes human error and accelerates the following processes:
- Handle customers' return requests through an online portal
- Generates and automatically provides return shipping labels
- Automatically processes refunds and exchanges
- Automatically manages inventory
- Sends automated updates to customers
What makes returns management software great?
There are several key reasons why returns management software is a valuable tool for any ecommerce business. From helping you automate your returns process to helping you reduce your return rate through insightful data, here are just a few top reasons why the right returns management solution can be highly beneficial:
Helps automate your product returns process
Managing returns is often a time-consuming process — and an expensive one. According to Axios, returning a $50 item costs retailers an average of $33. And slow, clunky processes are a big part of the issue.
By automating much of your product returns management process, returns management software can make handling online returns much less of a hassle:
- Automatically generating return labels
- Providing customers with a self-service return portal
- Automatically sending out shipping updates for returned products
📚 Related reading: Our guide to automating customer service processes to save time and improve support quality.
Integrates with other ecommerce tools
One of the most important things to look for in returns management software is its existing integrations. For example, returns software that integrates with your email marketing platform makes sending out customized shipping updates easy.
Meanwhile, choosing returns software that integrates with your customer support platform makes it easy for support agents to process returns while assisting customers. Below, we’ll link whenever a returns tool integrates with Gorgias to save you the time of searching.
 |
These are just a couple of examples of the value you gain when your returns management system integrates with the other tools your ecommerce store uses.
Offers speedy service for returns
84% of shoppers say that they will not purchase from a retailer again after a bad returns experience. So, offering speedy service for returns is mission critical. By streamlining and automating your returns process, the right returns management software can make the process faster and more convenient for your customers.
Provides easy to read data analytics and has a clean dashboard
According to data from Statista, reverse logistics — otherwise known as returns management — cost U.S. businesses a total of $102 billion in 2020 alone. If you want to reduce returns' impact on your store's bottom line as much as possible, it is essential to optimize both your returns process and the customer experience with your products.
To this end, nothing is more important than the customer returns data that you collect. By providing returns data in a clean and organized dashboard, returns management software makes it much easier to draw the insights you need to process returns in a more cost-effective manner. It also offers your customers a better experience, which lends itself to a lower return rate.
📚Recommended reading: Our VP of Success’ guide to evaluating customer service.
{{lead-magnet-2}}
10 best tools for returns management
If you are looking for tools that will make managing returns much more efficient and convenient for you and your customers alike, there are several excellent options to consider adding to your tech stack. Here are our picks for the top nine returns management tools.
Next to each tool, we’ll list the G2 review score to help you understand current user satisfaction.
1) ReturnLogic: 4.8 ⭐(10 reviews)
ReturnLogic is a comprehensive solution designed to automate the entire returns process, offering customizable workflows that can automate tasks such as:
- Printing shipping labels
- Tracking return shipments
- Inventory management
ReturnLogic also offers warranty processing for accepting warranty claims from third-party purchases, powerful insights and analytics, and a customizable return portal designed to make returning products more convenient for your customers.
Another key benefit of ReturnLogic is that its return portal is designed to encourage customers to exchange items rather than request refunds, enabling you to further reduce the impact of returns on your store's profits.
Pros
- Long list of useful integrations
- Designed to encourage exchanges for returned items rather than refunds
- Wealth of insightful analytics regarding your products and returns process
Cons
- Expensive pricing
- Limited "return reasons" options in the self-service portal
- Sometimes clunky and difficult to navigate
Key Features
- Easy to create custom returns workflows
- Ready-to-use return center that automates the returns process, warranty process, and refund process
See more about ReturnLogic’s integration with Gorgias.
2) Returnly: 3.5 ⭐(5 reviews)
With Returnly, ecommerce store owners can create customized return portals designed to optimize the customer experience and make returns less of a hassle for your customers and support team alike. Along with an attractive and easy-to-use return portal, Returnly also offers a range of automation rules that enable you to control how and when returns get processed.
Finally, Returnly provides detailed analytics and returns data that you can leverage to optimize your returns process further. The result is a well-rounded returns solution that offers everything online store owners need to reduce the expense and hassle of managing returns.
Pros
- Easy to offer store credit in exchange for returned items
- Plenty of customization options
- Instantly provides credits for returned items to improve customer retention
Cons
- Only capable of integrating with one shipping carrier at a time
- Doesn't provide the option to override automated emails
- Isn't as easy to set up and use as other returns management software
Key Features
- Tools for engaging customers at every point throughout the returns process
- Automatically sends out tracking updates for exchanged items
See more about Returnly’s integration with Gorgias.
3) Loop Returns: 4.6 ⭐(57 reviews)
As one of the more popular returns management solutions today, there's a lot to like about Loop Returns. With Loop Returns, store owners can create a branded return portal complete with automations that streamline the returns process, and feedback forms to generate valuable insights on why customers return their products.
The Loop Returns return portal also encourages exchanges, allowing your store to retain more revenue. Another key benefit of Loop Returns is that it enables customers to use a QR code to return their product rather than printing a shipping label (though Loop Returns does offer customers the option to print a shipping label as well).
📚Recommended reading: Learn how Kulani Kinis Saves $400k in Refunds Using Gorgias + Loop Integration
Pros
- “Reason for return” forms provide valuable insights that can be used to reduce your return rate
- Exchanges are instantly approved, and exchange credit is instantly applied to the customer's account
- Long list of useful integrations
Cons
- Somewhat pricey
- Customer support issues have been reported
- Many features are only available on upper tiers
Key Features
- Offers customers who choose a refund rather than exchange a bonus credit if they choose to exchange instead
- Allows customers to automatically apply the value of their return to any item in your store
See more about Loop’s integration with Gorgias.
4) LateShipment.com (no reviews on G2)
LateShipment.com is a post-purchase experience platform designed to improve multiple aspects of a store's post-purchase process, including order tracking and returns management.
One of the best features of LateShipment.com is that it provides a litany of order fulfillment data points, including real-time tracking updates that can be sent automatically to customers via email or SMS. Regarding returns management, meanwhile, LateShipment.com offers a customizable return portal complete with real-time tracking and a wide range of rules and automations that you can use to customize and automate your returns process.
Finally, LateShipment.com promises to recover every dollar lost to carrier errors by automatically auditing shipping invoices and requesting refunds when an error occurs, helping your business save on shipping costs.
📚Recommended reading: Learn how to offer your customers free shipping without breaking the bank.
Pros
- Comprehensive post-purchase platform that isn't limited to returns management alone
- Flexible plans and pricing allows you to choose the features that best match your needs and budget
- Plenty of customization options
Cons
- Late packages are sometimes incorrectly labeled as "suspect lost"
- Daily metrics doesn’t support USPS
- Customer support issues have been reported
Key Features
- Automatic real-time tracking updates for both orders and returns
- Automates refund claims for 50+ carrier errors
See more about LateShipment.com’s integration with Gorgias.
5) yayloh: 4.6 ⭐ (4 reviews)
yayloh is a return management platform that automates and optimises the returns process for fast-growing direct-to-consumer brands, particularly those in the fashion and lifestyle market.
With customisable workflows, yayloh reduces the workload for customer service teams and provides customers with a fully-digital and branded self-service returns experience.
The platform stands out for its focus on return data. yayloh collects and analyses customer feedback in top-tier data dashboards and datasets to help merchants make data-driven product adjustments to reduce returns rates.
With yayloh's all-inclusive solution, brands of all sizes can scale their businesses, boost customer loyalty and reduce returns, all while ensuring a smooth and efficient post-purchase experience for customers.
Pros
- Top-tier returns data dashboards and datasets (allow CVS export)
- Auto-refunds based on different triggers
- Tailored to support fashion and lifestyle brands at any stage of growth
- In-depth “returns reasons” with newly introduced returns keyword tags
Cons
- More established in Europe. They're actively working towards expanding our presence in the US/Asia.
Key Features
- Advanced data and analytics features
- Open APIs for integration with all e-commerce platforms and Shopify App
- Supports well for international expansion — paperless trade
- Fully-digital and branded returns process
See more about yayloh's integration with Gorgias.
6) OrderHive: 3.7 ⭐(26 reviews)
Unlike many solutions on this list, OrderHive is not designed specifically for returns management. However, OrderHive's excellent inventory management and ecommerce automation features can be incredibly valuable for optimizing your returns process.
For example, OrderHive's real-time tracking features make it easy to provide customers with tracking updates on product exchanges. At the same time, the platform's inventory management tools simplify the process of updating your inventory when returns are processed.
But the real value of OrderHive comes from its wide range of ecommerce automation features. These features enable you to automate an incredibly long list of routine tasks, including tasks associated with returns management — such as processing returns and updating inventory levels.
Pros
- Affordable pricing with multiple plans to choose from
- Streamlines and automates every aspect of order fulfillment and returns management
- Enables you to set customized return policies
Cons
- Sometimes prone to frustrating bugs and errors
- Information from carriers often takes a while to update
- Analytics and reporting features are somewhat limited
Key Features
- Excellent inventory management solutions for handling returned products
- Real-time tracking and rate comparisons for 200+ shipping carriers
🧰 Tool: Want to update your returns policy? Use our free template generator to get started.
7) Return Rabbit 4.5 ⭐(6 reviews)
The features offered by Return Rabbit might not be anything all that new or revolutionary, but Return Rabbit is very good at what it does nonetheless. With Return Rabbit, ecommerce store owners can:
- Create branded return portals
- Set up customized automation rules and return policies
- Provide customers the option to return products via a QR code
Similar to other tools on this list, Return Rabbit encourages exchanges via customized product recommendations presented to customers in the return portal.
Pros
- Wide range of automation rules that go well beyond the generic rules offered by many platforms
- Designed to encourage customer feedback that can turn into valuable insights
- Robust reporting and analytics provide complete visibility into your returns process
Cons
- Only compatible with Shopify stores
- More expensive than many comparable options
- Customer support issues have been reported
Key Features
- Provides customers the option to return their product via a QR code rather than print a shipping label
- Instant exchanges and customizable product recommendations encourage exchanges over refunds
📚 Recommended reading: The best Shopify apps for growing your ecommerce business.
8) 12Return: 4 ⭐(1 review)
12Return is a returns management solution designed for both brick-and-mortar and ecommerce stores. For ecommerce stores, 12Return offers the ability to create both branded return portals and merchant dashboards designed to simplify the returns process for customer support agents.
12Return also provides customizable automation rules for authorizing returns and automating a wide range of returns management tasks.
Perhaps the most unique feature of 12Return is local returns processing, which enables customers to ship returned products to a local 12Returns hub for a faster and more efficient returns process.
Pros
- Local shipping can reduce return shipping costs
- Great customer support
- Powerful yet easy-to-use merchant dashboard makes the returns process much more efficient for customer support agents
Cons
- Somewhat tricky to set up and use
- Pricing is only available upon request
- Limited analytics and reporting
Key Features
- Automated tracking event updates for returned products
- Create on-demand digital labels
- Utilize 12Return's local shipping hubs for faster and more affordable returns
9) ReverseLogix: 4.4 ⭐(11 reviews)
ReverseLogix is a platform that offers everything you could want from a returns management solution, along with a few unique features you probably won't find anywhere else.
ReverseLogix boasts standard returns management features such as:
- Creating branded return portals
- Generating on-demand shipping labels and QR codes for customers
- Rules for automating your returns process
However, they also offer features such as configuring returns workflows based on priorities such as sustainability and cost-effectiveness, and a Repairs Management module for managing part replacements and warranty-based repairs.
Another nice feature of ReverseLogix is its detailed reporting, designed to provide insights into your returns process and the customer's experience with your products.
Pros
- Excellent analytics and reporting
- Lots of features in a single package
- Great customer support
Cons
- Somewhat prone to glitches and bugs
- Long and complex integration process
- Expensive compared to similar tools
Key Features
- Returns workflows can be configured based on a variety of business priorities
- Repairs Management module for managing part replacements and warranty-based repairs
{{lead-magnet-2}}
10) Ordoro: 4.7 ⭐(9 reviews)
Ordoro is a comprehensive order fulfillment platform that can manage orders and returns. With Ordoro, you can look forward to a long list of order fulfillment features, including:
- Automation rules and shipping presets for automating your returns and order fulfillment processes
- Automated shipping label generation
- Detailed order fulfillment
- Returns management
- Inventory management reporting
- UPC barcode support
- Automatic PO generation based on inventory levels
If you are looking for an all-in-one solution to order fulfillment, inventory management, and returns management, then Ordoro is a great option to consider.
Pros
- Broad range of features and capabilities under a single platform
- Great customer support
- Free Starter plan that lets you try out the platform's basic features
Cons
- Somewhat difficult to navigate
- Updates are few and far between
- Occasional delays when syncing between shopping carts and Ordoro
Key Features
- Automation rules for order fulfillment, returns management, and inventory management
- UPC barcode support
Want more suggestions? Check out our list of 150+ top ecommerce tools or our list of the best shipping software for ecommerce.
Enhance your ecommerce store with Gorgias
Managing returns is one of the necessary evils of running an online store. With the right returns management software, you can greatly mitigate the expenses and hassles associated with returns management.
Integrating these solutions with a powerful customer support platform such as Gorgias makes them even more beneficial. The ability to integrate with a wide range of returns management solutions is just one of the features that make Gorgias the premier customer support solution for ecommerce stores.
With Gorgias, you can create automated customer support workflows to assist with returns management and other customer support tasks. Along with these powerful automation rules, Gorgias also offers live chat support, a centralized customer support dashboard, advanced customer support reporting and analytics, and so much more.
To see for yourself how our industry-leading customer support software can enhance your returns process and your ecommerce business as a whole, sign up for Gorgias today!

9 Instagram Comment Ideas for Online Businesses
On Instagram, the most common types of engagement are likes and comments. For likes, you can’t do much about them, but you can take advantage of Instagram comments to drive more engagement, build relationships with followers, increase customer trust, and even boost conversions.
If your business has a strong presence on Instagram, you may receive a lot of comments from followers. That means you have a higher chance to turn comments into your advantage.
But sometimes, it’s easier said than done, right? With a flood of comments every day, you may struggle to respond and manage them effectively.
That’s why this post is for you. You’ll learn several Instagram comment ideas to interact with your followers and some useful tips to monitor comments without losing your mind.
{{lead-magnet-1}}
9 Instagram comment ideas and tips for ecommerce businesses
- Respond to comments in a timely manner
- Speak like a human being
- Add a touch of humor to your comments
- Use relevant emojis to make comments eye-catching
- Say thank you
- Apologize for customer support issues that come up
- Ask for followers' emails if necessary
- Don't delete or hide comments
- Don't just comment on your own posts
Why You Should Care About Instagram Comments
The average post on Instagram receives 285.48 comments, taking into account posts of highly influential users. Mention found that 26% of Instagram users love to comment on or share personal Instagram Stories.
Why do people comment on others’ posts?
The reasons are many. For example, they want to ask a question, give feedback, share a personal perspective, add to discussions, or interact with a community. Sometimes, they feel so resonated with a story that they want to start a conversation.
Whatever the reasons, the Instagram comments section gives you a huge opportunity to communicate with your followers and discover potential customers.
Here are three main reasons why you should create an Instagram comment strategy:
Comments Reflect Engagement
Think this way: if you’ve uploaded a photo and received 20 comments within only five minutes, you probably have a lot of following on Instagram, or your content is very engaging, right?
The opposite is true as well. If you get a few comments whenever you publish a post despite having a huge following, your engagement rate may be low. In this case, you should probably rethink your Instagram comment strategy.
Responding to Comments Help Build Brand Trust
When a customer mentions you on Instagram, a lot of eyes are on you. How you handle that can tell a lot about your social media management and customer service. If you respond to it tactfully, it shows you care about your customers and take control of the situation.
Meanwhile, choosing to shy away and remain silent will lead to people bad-mouthing your brand. And as you might know, words can travel fast.
By providing great customer service through Instagram comments, you not only retain existing customers but also win new ones.
Instagram Comments Ideas and Tips
Below are Instagram comment ideas and tips you can apply right away. Note that there is no one-size-fits-all answer – every comment and every situation is different. Use the following as a reference to create the right strategy for your business.
1. Respond to Comments in a Timely Manner
When customers ask a question, they want an answer instantly. This is true, especially if the question is about product availability, price, or shipping issues.
Aim to respond to Instagram comments within 24 hours. This way, you can build trust with your followers and leave them a good impression of your business.
Look at all of Dannijo’s posts, and you can see they respond to comments within minutes, if not seconds. No wonder they have great engagement.

Using Instagram Quick Replies is a great way to do that. This cool feature allows you to create draft messages for commonly asked questions, like “what is the shipping cost?” or “can I return the item?”

Whenever you want to use those messages, just insert the “quick reply” instead of typing out the same message multiple times.
You can use Instagram Quick Replies on mobile devices (iPhone and Android). But this feature is only available for Instagram business accounts. So make sure you set up an Instagram business page beforehand.
2. Speak Like a Human Being
Like other social networks, Instagram is about two-way conversations. But we don’t join Instagram to talk with bots – we want to share, discuss, and speak with humans. We seek real, genuine connections.
That’s why brands must be human when interacting with followers on Instagram. Speak to them like you’re already in a relationship with them, as if you’re good friends. Avoid using a formal and distant tone.
3. Add a Touch of Humor to Your Comments
You should take customer queries and complaints seriously, but there are times when you can add a bit of humor to entertain a conversation. According to Hootsuite, “entertaining content is one of the top five reasons people follow particular brands or individuals online.”
Think about when you saw an animated GIF on Tumblr or a funny tweet. You couldn’t help but sharing it with your circle, right? That’s why adding a touch of humor to your Instagram comments can be helpful to connect with your audience instantly.

Make a good joke, and your followers will share it with their followers. Some of those followers will start following you to get more jokes, and your outreach will grow exponentially. More followers, more customers. It’s as simple as that.
4. Use Relevant Emojis to Make Comments Eye-catching
Emojis aren’t common in Instagram posts, but comments too. More and more brands are responding to their Instagram comments with emojis.

Emojis are friendly, fun, and engaging. They’re great for humanizing your brand and connect with followers quickly.
A worthy note is that before using emojis, ask yourself if it aligns with the tone of your brand. Make sure you understand the meanings of different emojis so you can use them the right way.
It’s also important to understand whose comment you’re responding to. Just because you see other followers using emojis doesn’t mean everyone is okay with them. Learn more about your target audience to create an emoji marketing strategy that makes sense for your business.
5. Say Thank-you
A thank-you comment is necessary when someone gives you a compliment or mentions you on Instagram. Something as simple as “Thank you” or “Thanks” or “Glad you like this one” is more than fine. If they called out specifics in their comments, try to respond with a similar level of personalization. Show them your appreciation.
Another tip is when saying thanks to your followers, try to expand the conversation. If a follower said they were happy with your order, you could ask them why they liked it. Let them know you’re available to support them whenever they need help.
6. Say Sorry for Customer Service Issues
If a customer reaches out to your Instagram with a question or a customer service issue, you must respond to them. You should provide that support.
Here are some helpful tips to handle followers’ complaints on Instagram:
- Keep calm, say sorry, and show your responsibility for the issue
- Answer their questions accurately and promptly
- Be specific and helpful about your solution
- Don’t overpromise unless you’re 100% sure that you can give them what they want
- Come bearing gifts or discounts if necessary
7. Ask for Followers’ Emails If Necessary
If a follower’s question is complicated and requires a wordy answer or needs more time to fix, you ask for their email address in the comments and send the full response through email.

It’s an opportunity for you to impress your follower with the high level of customer service you provide. Ensure you let the follower know you’ll contact them via their email.
8. Don’t Delete or Hide Comments
A lot of people will tell you to ignore or delete negative comments on your Instagram posts. But wait… rethink before you do that.
Of course, dealing with difficult customers is never easy, and it only gets more challenging when both of you don’t understand each other or the customers expect more than what you can offer.
Despite that, it isn’t a smart move to delete comments. Why? Because the difficult customers might do the following:
- Stop buying from you and spread bad words about your business
- Continue speaking negatively about your brand across social media channels
- Continue commenting negatively on your posts until you block them or remove them from your community
With all that being said, it’s obvious that you should come up with a strategy to handle negative comments, instead of just deleting them.
A good tactic is to reply to those comments or direct message commenters with an apology. Then, ask for more information about why they made that statement. Explain you need this information to figure out the best solution for them.
If the person continues to be an issue after you’ve attempted to resolve the matter, try to move the conversation to a private space (like an email) or block them when necessary.
It seems a lot of work, but keep practicing that. It’ll help improve your brand’s online presence and make people remember your excellent customer service.
9. Don’t Just Comment on Your Own Posts
If you just start using Instagram for your business, commenting on other posts is a good idea. Doing that will help you identify your target audience, understand what they need, expand your brand awareness, and drive engagement to your Instagram profile.
You can comment on your followers’ posts, influencers’, or the posts of brands that are relevant to your niche.

If you’re struggling with identifying who you should start interacting with, look at your recent collaboration or co-marketing projects. Then, start engaging with them.
How to Manage Instagram Comments Effectively
Have you ever glanced at your (hundreds of) Instagram notifications and feel tired of replying to your followers’ comments? You see many comments on some much older posts and don’t know which one to start with. AGRH. You get lost.
If you’re in this situation, the first thing you should do is set a specific time to handle Instagram comments. Give yourself windows of time when you’re pleased to respond to those messages. Doing that can help you remove distractions, maintain concentration, and increase productivity.
The second tactic is to use an all-in-one customer service tool like Gorgias.
Think this way: Your customers aren’t on Instagram only. They may also follow your business on Twitter and Facebook. Some of them may prefer connecting with you via email, SMS, or phone call. Others might often visit your website and find it convenient to chat with you via chat box.
That’s where tools like Gorgias (and other social media apps that integrate with your Shopify store) come in handy.
Gorgias' social media features allows you to centralize all customer requests and comments across channels into a single dashboard. You can easily manage every customer interaction on Instagram (for instance: Instagram comments, Instagram ads comments, Instagram mentions), emails, and other messages – using only Gorgias is enough to deliver an exceptional omnichannel customer experience.
Gorgias also helps streamline your team collaboration. When someone comments on your Instagram, a corresponding ticket is automatically created. You can solve the ticket right away using macros, change its status, or assign it to another agent. Everything will be done inside Gorgias without you logging into your Instagram app.
Don’t Ignore Instagram Comments
Take the time to go through Instagram comments and address them. Show your followers that you care about them, appreciate their engagement, and strive to maintain relationships with them. The more you do that, the more your followers want to stick with you and support your business.
Interested in using Gorgias to monitor Instagram comments and customer inquiries on other channels? Sign up for a Gorgias account today and discover all the premium features our ecommerce ticket management help desk offers.
{{lead-magnet-2}}

Building delightful customer interactions starts in your inbox
